Fig. 14.
Download original image
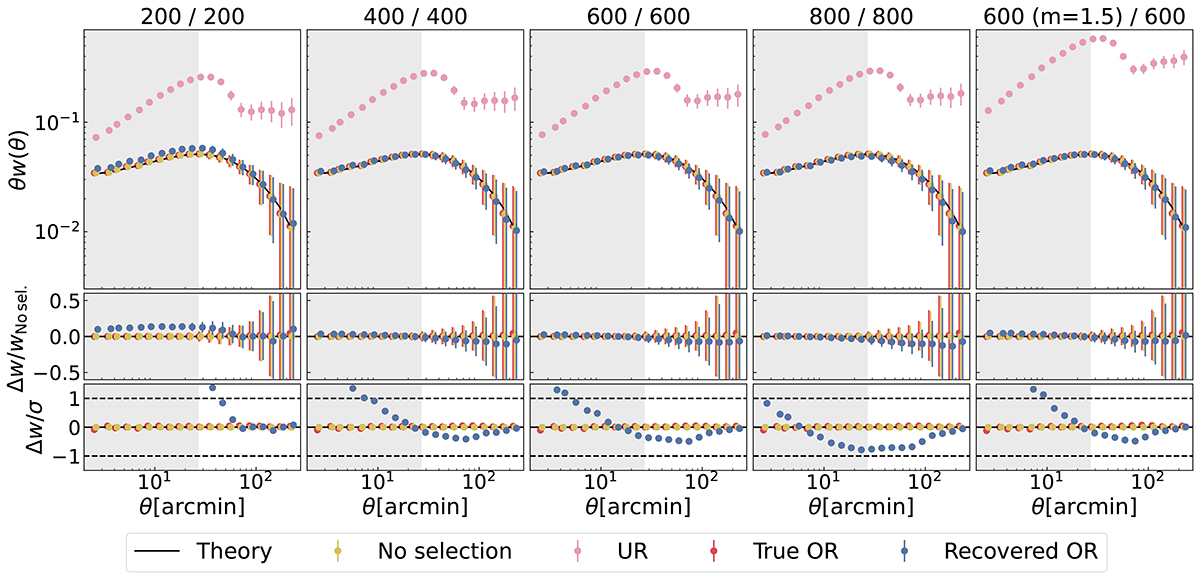
2PCFs measured for the data-driven systematics test with the same choices of NCKiDS (the number of hierarchical clusters for the data-driven OR) and NCrec (for the recovered mock OR) Each column of panels corresponds to one set-up. Nside is fixed at 2048 for both the data-driven OR and the recovered OR. The right-most column is an enhanced data-driven OR with m = 1.5 according to Eq. (21). The top panels show the 2PCF data points calculated as the mean values from 40 GLASS realisations, and the error bars are calculated as the square root of the diagonal terms of the theoretical covariance matrix. The middle panels show the biases in 2PCFs with respect to the No selection 2PCFs and the bottom panels show the biases relative to the errors in the 2PCFs (The UR case is well beyond the range). The shaded regions are angular scales corresponding to a physical scale r < 8 h−1 Mpc at the mean redshift of the galaxy sample.
Current usage metrics show cumulative count of Article Views (full-text article views including HTML views, PDF and ePub downloads, according to the available data) and Abstracts Views on Vision4Press platform.
Data correspond to usage on the plateform after 2015. The current usage metrics is available 48-96 hours after online publication and is updated daily on week days.
Initial download of the metrics may take a while.