Fig. 11.
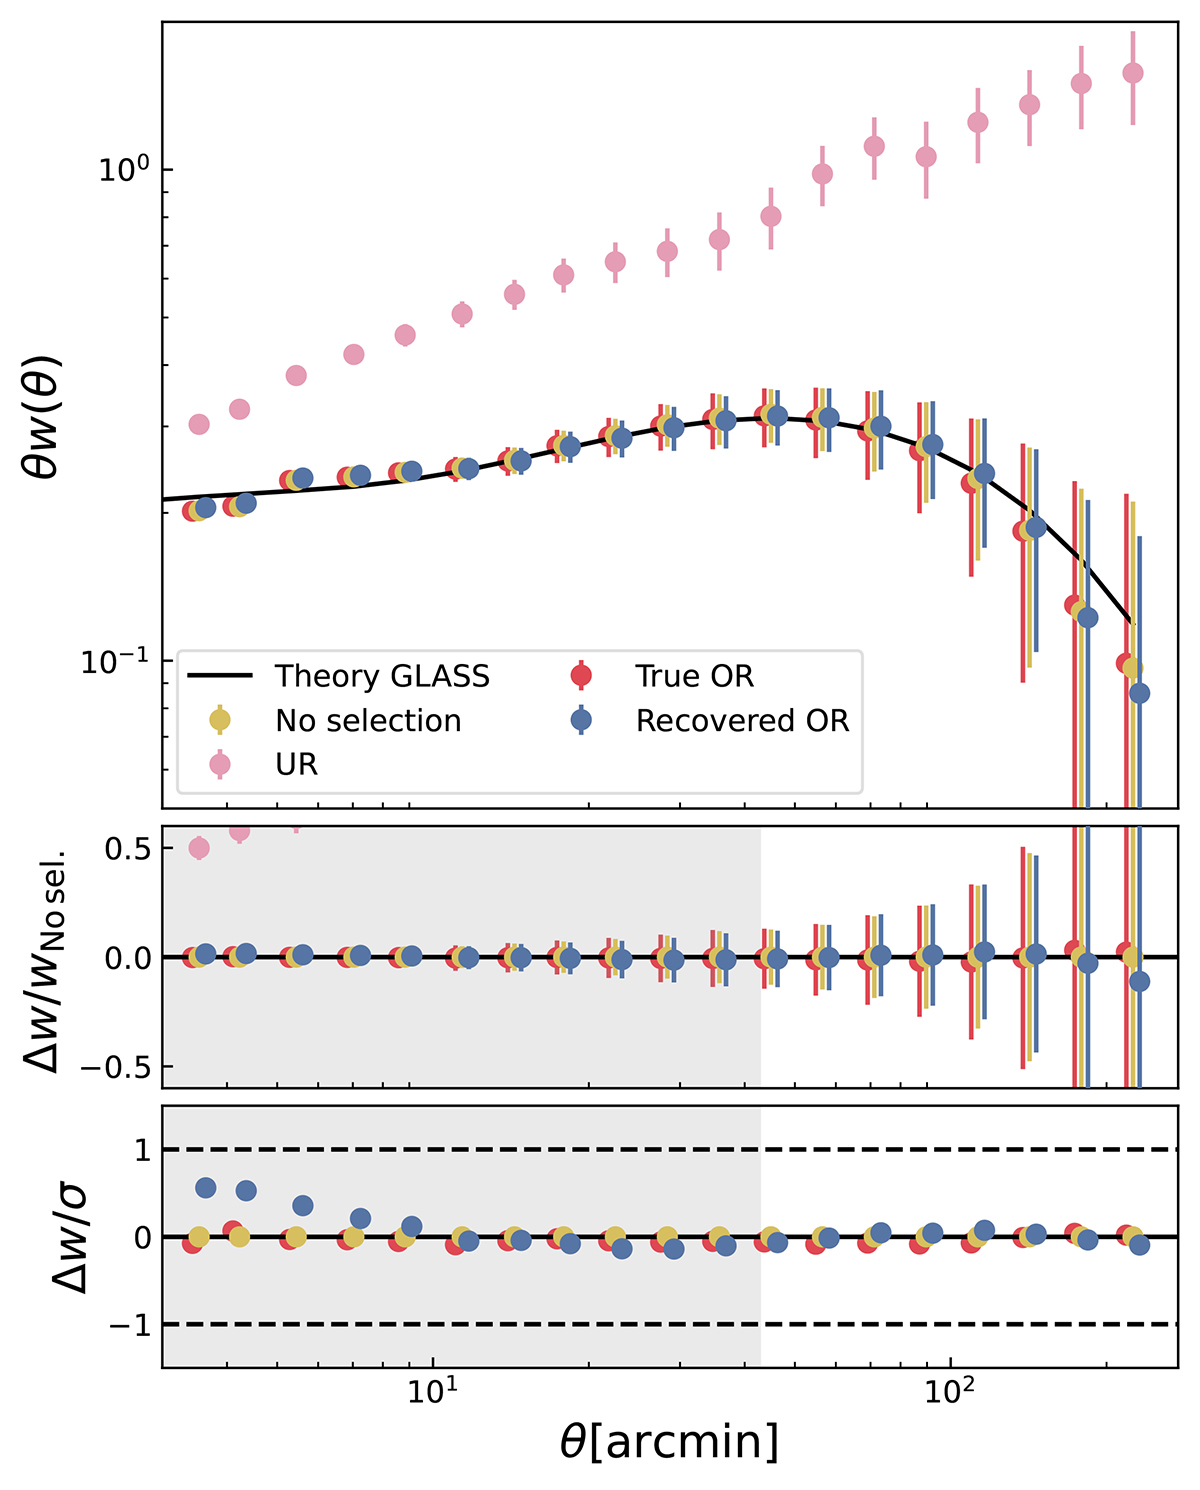
Download original image
Top panel: Measured w(θ) in the toy-systematics test. The definitions of the four w(θ) are presented in Table 2. The data points are the mean w(θ) from 40 realisations and the error bars are the diagonal elements of the covariance matrices evaluated from the realisations. The black curve is the theoretical w(θ) computed with PYCCL (Chisari et al. 2019) using the same cosmology and redshift distribution. The shaded region shows the angular scale smaller than 8 h−1 Mpc evaluated at the mean redshift. The middle panel is the relative bias of each w(θ) with respect to the No selection case, and the bottom panel is the w(θ) bias related to the error. Most points of the UR case are drastically biased and are outside the range of the middle and bottom panels.
Current usage metrics show cumulative count of Article Views (full-text article views including HTML views, PDF and ePub downloads, according to the available data) and Abstracts Views on Vision4Press platform.
Data correspond to usage on the plateform after 2015. The current usage metrics is available 48-96 hours after online publication and is updated daily on week days.
Initial download of the metrics may take a while.