Fig. 10.
Download original image
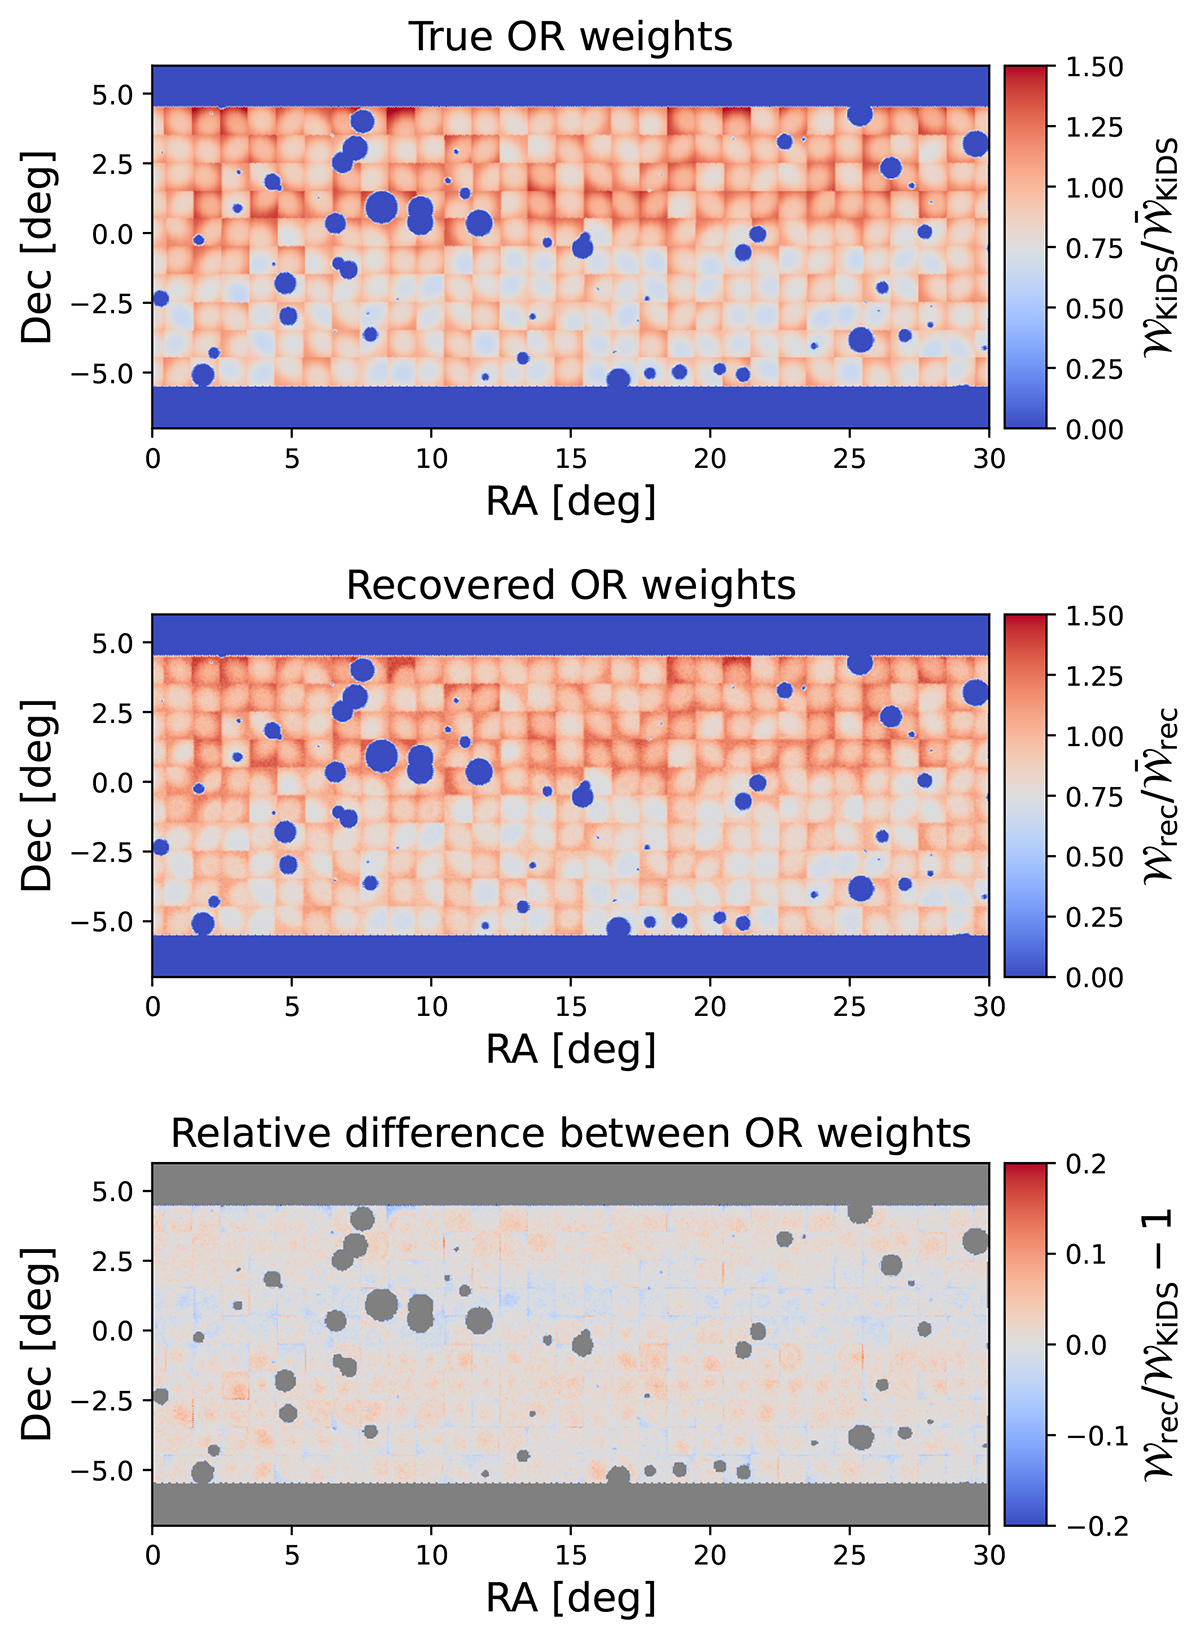
Top panel: True OR weights (normalised by their mean) calculated from the total selection function of the toy systematics; middle panel: Recovered OR weights generated by the SOM+HC method. Both panels show only part of the footprint. We note that the holes in the maps are masked regions around point sources; bottom panel: Relative difference between the recovered OR weights and the true OR weights.
Current usage metrics show cumulative count of Article Views (full-text article views including HTML views, PDF and ePub downloads, according to the available data) and Abstracts Views on Vision4Press platform.
Data correspond to usage on the plateform after 2015. The current usage metrics is available 48-96 hours after online publication and is updated daily on week days.
Initial download of the metrics may take a while.