Fig. 4.
Download original image
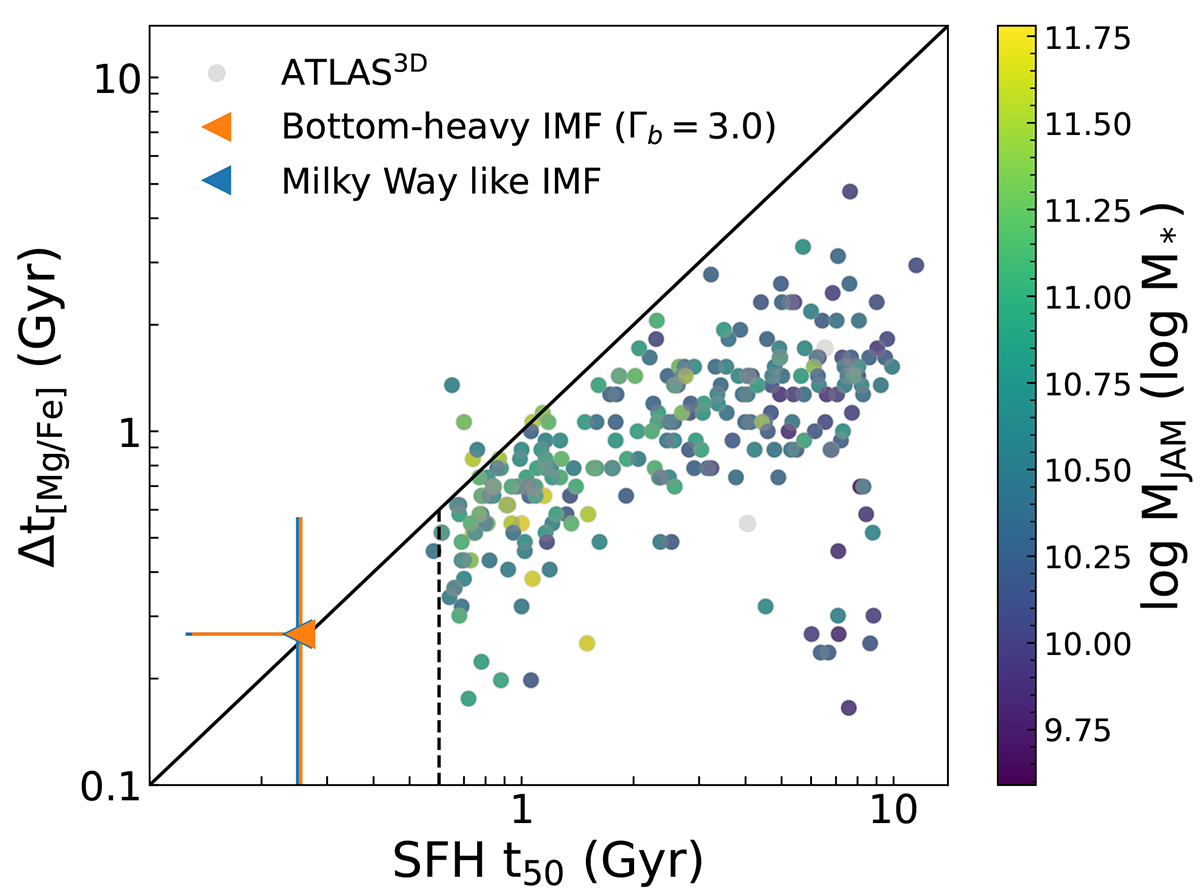
Chemical (t[Mg/Fe]) versus SFH (t50) formation time scales. Circles are the ATLAS3D sample with t[Mg/Fe] calculated using the expression from Thomas et al. (2005), colour-coded according to MJAM. In blue and orange we respectively show ZF-UDS-7329 with the Milky Way-like Kroupa and bottom-heavy IMFs. The vertical dashed line indicates the lower limit achieved in the ATLAS3D sample for z ∼ 0 measurements.
Current usage metrics show cumulative count of Article Views (full-text article views including HTML views, PDF and ePub downloads, according to the available data) and Abstracts Views on Vision4Press platform.
Data correspond to usage on the plateform after 2015. The current usage metrics is available 48-96 hours after online publication and is updated daily on week days.
Initial download of the metrics may take a while.