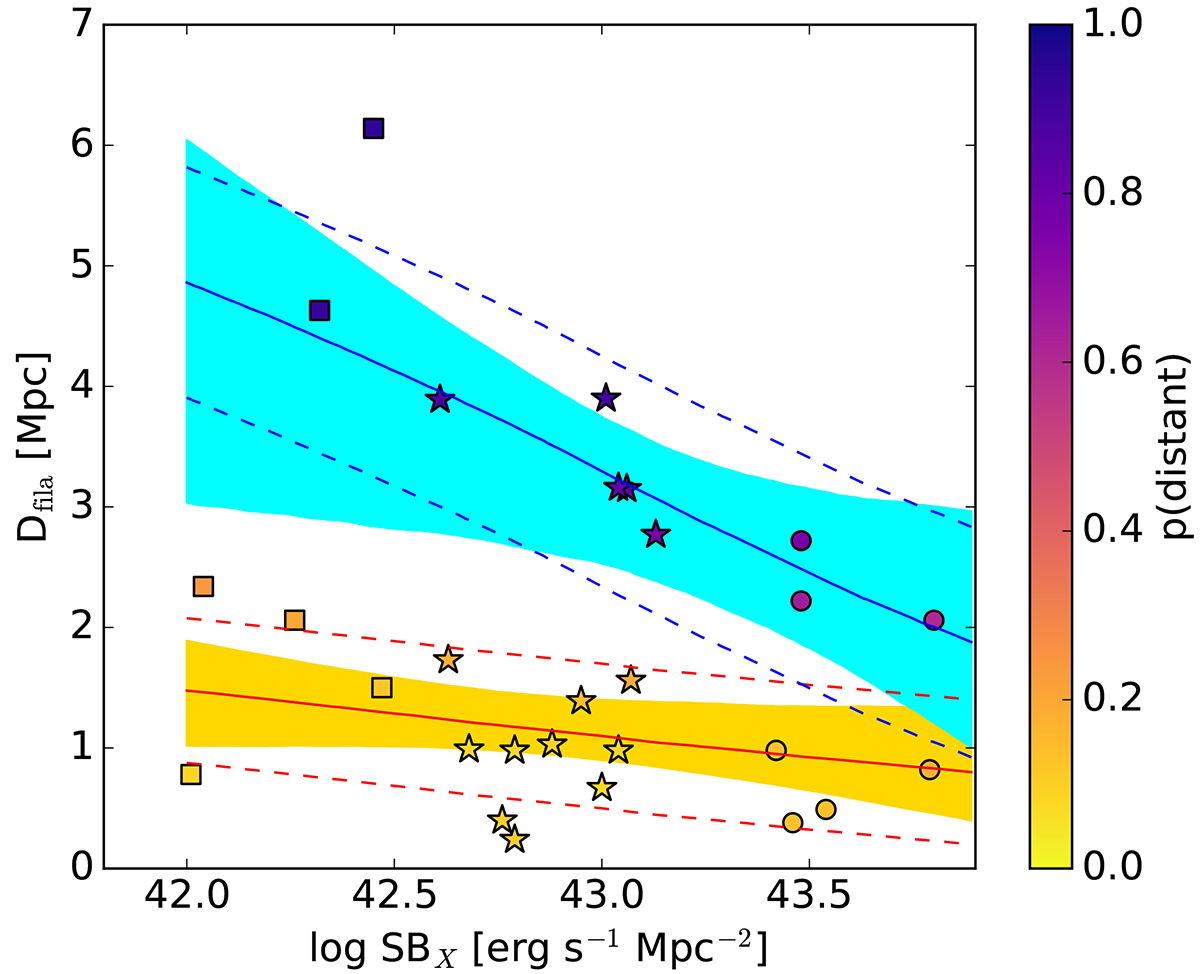
Fig. B.1.
Download original image
Distance between our clusters and the nearest filament as a function of their X-ray surface brightness SBX. Points are colour-coded according to probability of belonging to the more distant population. Shading indicates the 68% error on the fit, whereas the dashed corridors indicate ±1 the estimated scatter around the mean relation.
Current usage metrics show cumulative count of Article Views (full-text article views including HTML views, PDF and ePub downloads, according to the available data) and Abstracts Views on Vision4Press platform.
Data correspond to usage on the plateform after 2015. The current usage metrics is available 48-96 hours after online publication and is updated daily on week days.
Initial download of the metrics may take a while.