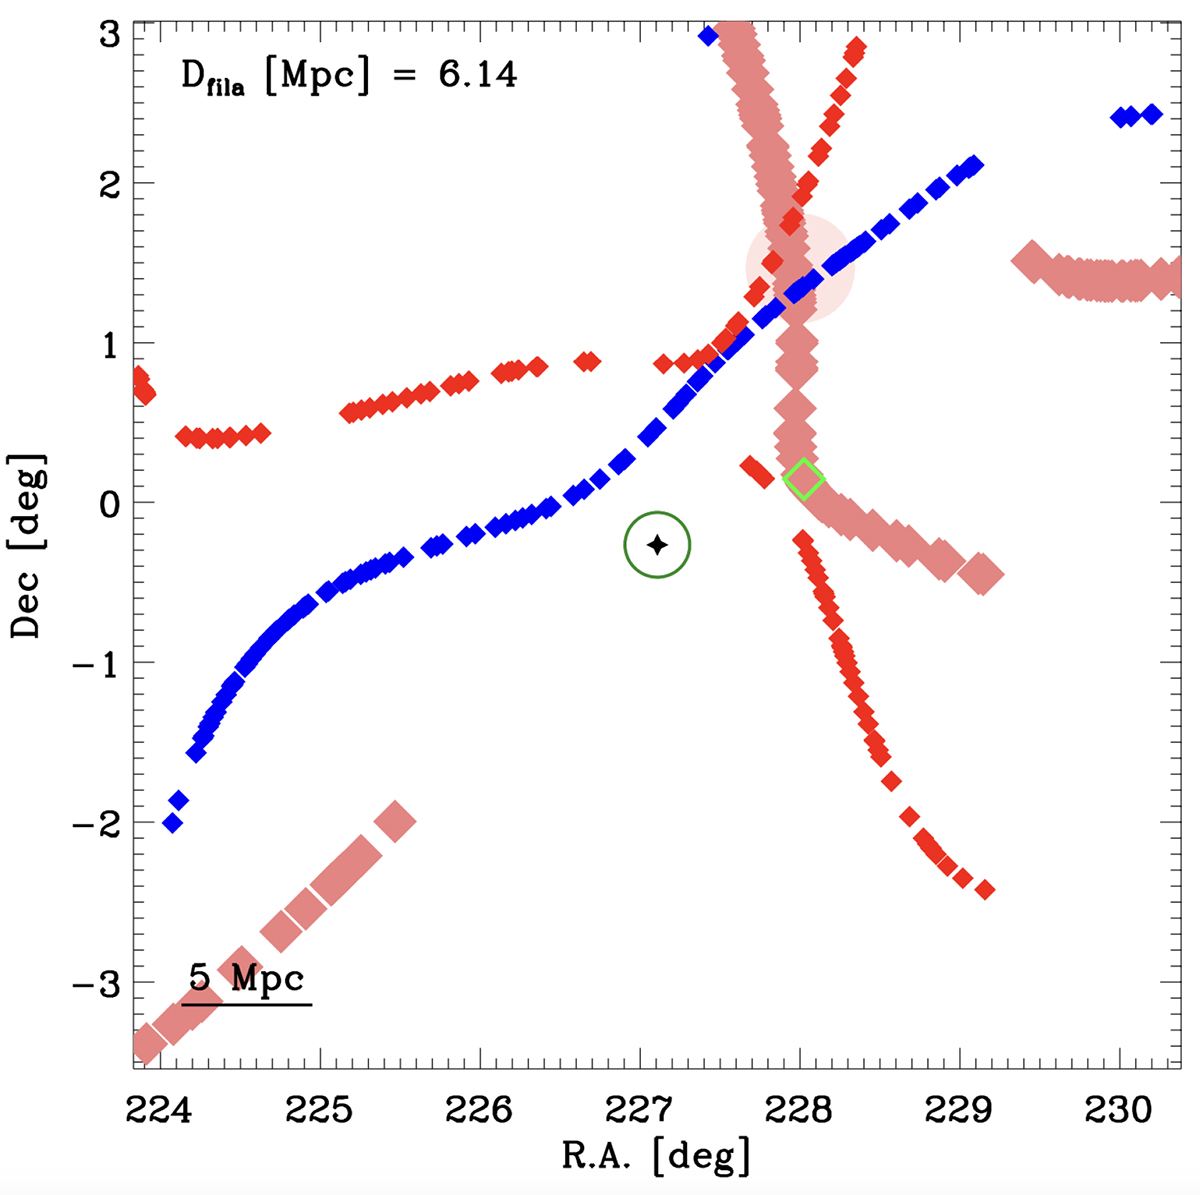
Fig. A.1.
Download original image
Large-scale structure around CL1011. The filaments and intersections in the correct redshift slice are reported in light coral and rose, as in Fig. 1. The green rhombus is the point to which the distance was measured. We also plot the filaments of the preceding (0.085 ≤ z < 0.09, in blue) and succeeding (0.095 ≤ z < 0.10, in red) redshift slices in order to look for filaments along the line of sight (e.g. extensions of filaments across different slices). None were found.
Current usage metrics show cumulative count of Article Views (full-text article views including HTML views, PDF and ePub downloads, according to the available data) and Abstracts Views on Vision4Press platform.
Data correspond to usage on the plateform after 2015. The current usage metrics is available 48-96 hours after online publication and is updated daily on week days.
Initial download of the metrics may take a while.