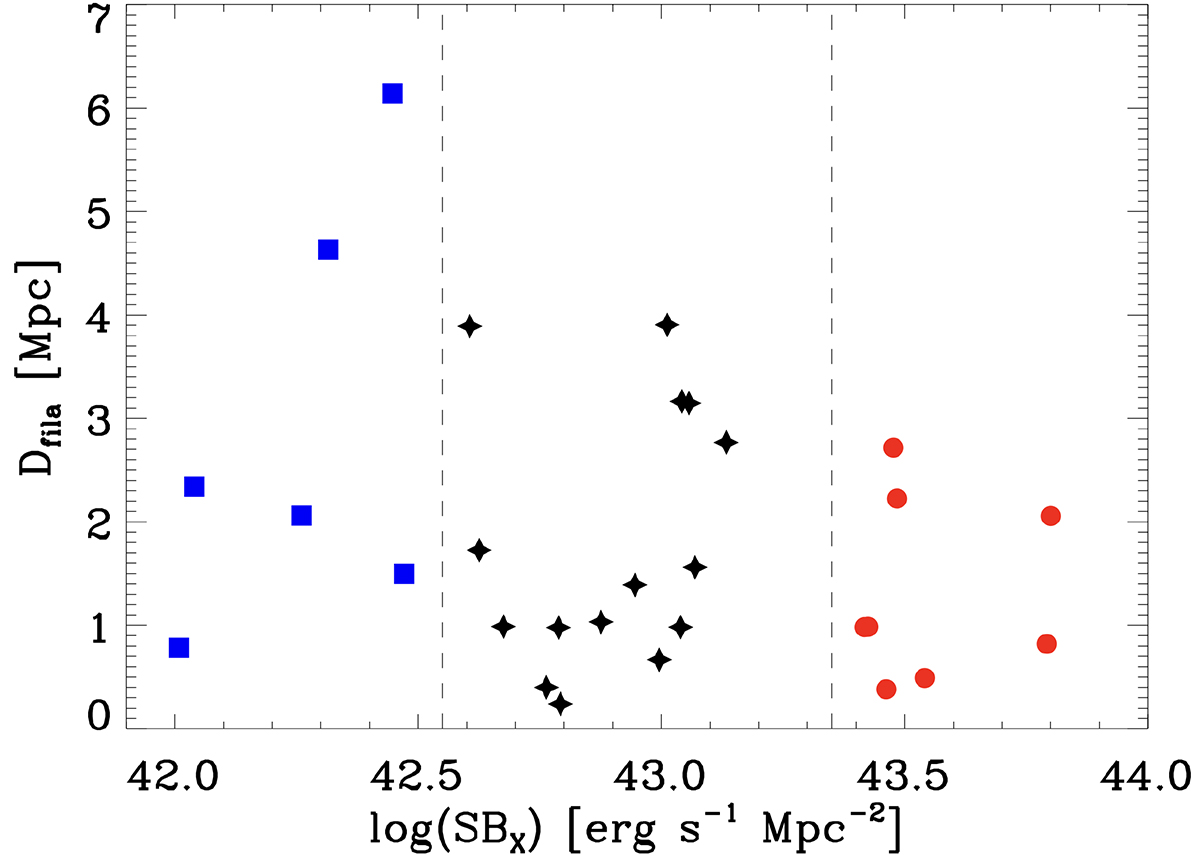
Fig. 2.
Download original image
Distance between our clusters and the nearest filament as a function of their X-ray surface brightness SBX. The figure is colour-coded according to the X-ray surface brightness: high surface brightness clusters are shown with red circles, low surface brightness with blue squares, and intermediate cases with black stars. The farthest object in our sample is highlighted with a blue open square, and it refers to CL1011, a peculiar case that we analyse in detail in Appendix A.
Current usage metrics show cumulative count of Article Views (full-text article views including HTML views, PDF and ePub downloads, according to the available data) and Abstracts Views on Vision4Press platform.
Data correspond to usage on the plateform after 2015. The current usage metrics is available 48-96 hours after online publication and is updated daily on week days.
Initial download of the metrics may take a while.