Fig. 6
Download original image
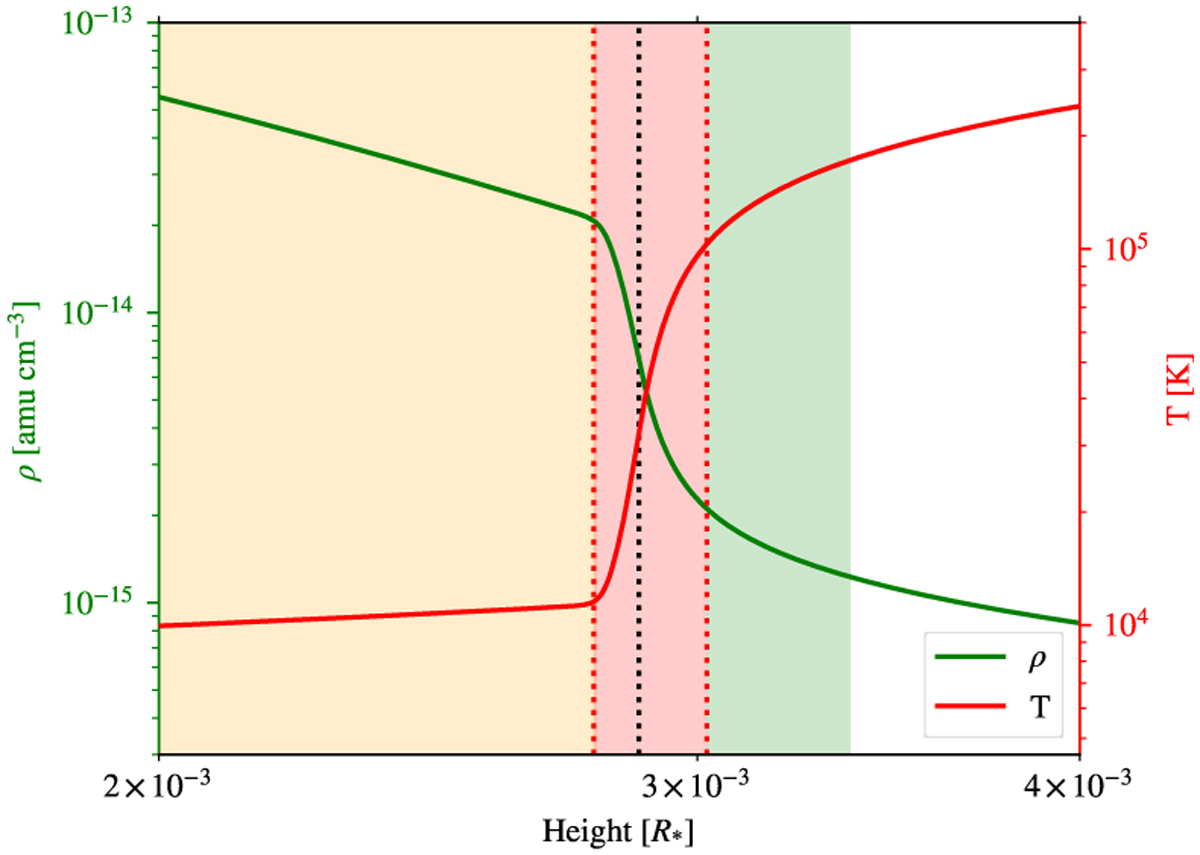
Highly magnified view near the transition region of the background solar wind profiles for ρ and T. The yellow, red, and green shades represent three distinct regions, with parameters from each used as inputs to the Leroy-1981 model. For reference, we also include the black dotted line indicating the location of the TR, consistent with the previous plots.
Current usage metrics show cumulative count of Article Views (full-text article views including HTML views, PDF and ePub downloads, according to the available data) and Abstracts Views on Vision4Press platform.
Data correspond to usage on the plateform after 2015. The current usage metrics is available 48-96 hours after online publication and is updated daily on week days.
Initial download of the metrics may take a while.