Fig. 5
Download original image
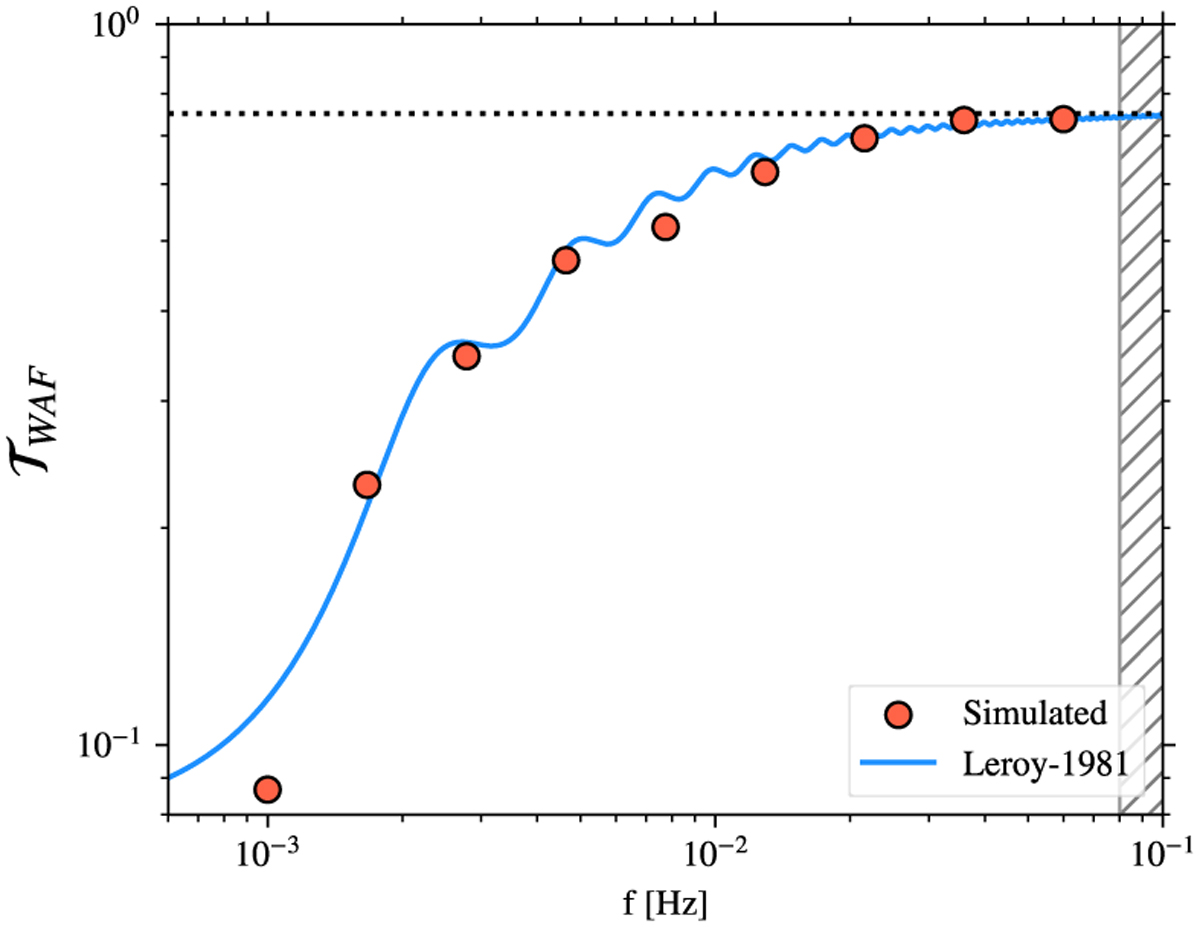
Transmittance (𝒯WAF) obtained from the simulations of frequencies ƒ0 to ƒ8, shown as red scatter points. The blue solid line is the analytical profile of transmittance obtained using the Leroy-1981 model. The horizontal dotted line represents the asymptotic value of the 𝒯WAF profile having a value of 0.75 obtained using the Leroy-1981 model. The gray hatched region is where PDI was found to significantly influence the transmittance.
Current usage metrics show cumulative count of Article Views (full-text article views including HTML views, PDF and ePub downloads, according to the available data) and Abstracts Views on Vision4Press platform.
Data correspond to usage on the plateform after 2015. The current usage metrics is available 48-96 hours after online publication and is updated daily on week days.
Initial download of the metrics may take a while.