Fig. 6
Download original image
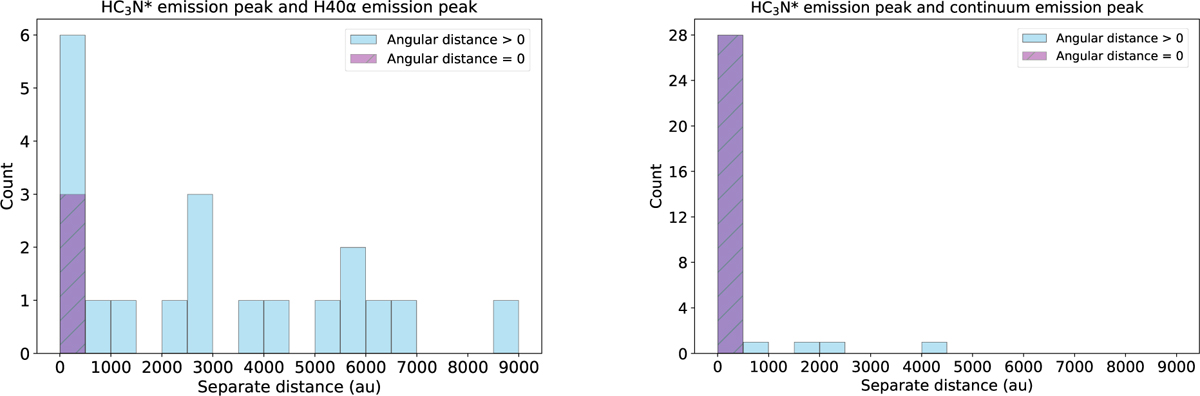
Histogram of the separations (angular distances) between the peak of the HC3N* emission and peak of the H40α emission for sources associated with UC HII regions (left panel) and the separations between the peak of the HC3N* emission and peak of the continuum emission for sources without UC HII regions (right panel). The blue bars represent sources with angular distances greater than zero, and the purple bars represent sources with angular distances equal to zero.
Current usage metrics show cumulative count of Article Views (full-text article views including HTML views, PDF and ePub downloads, according to the available data) and Abstracts Views on Vision4Press platform.
Data correspond to usage on the plateform after 2015. The current usage metrics is available 48-96 hours after online publication and is updated daily on week days.
Initial download of the metrics may take a while.