Fig. 6.
Download original image
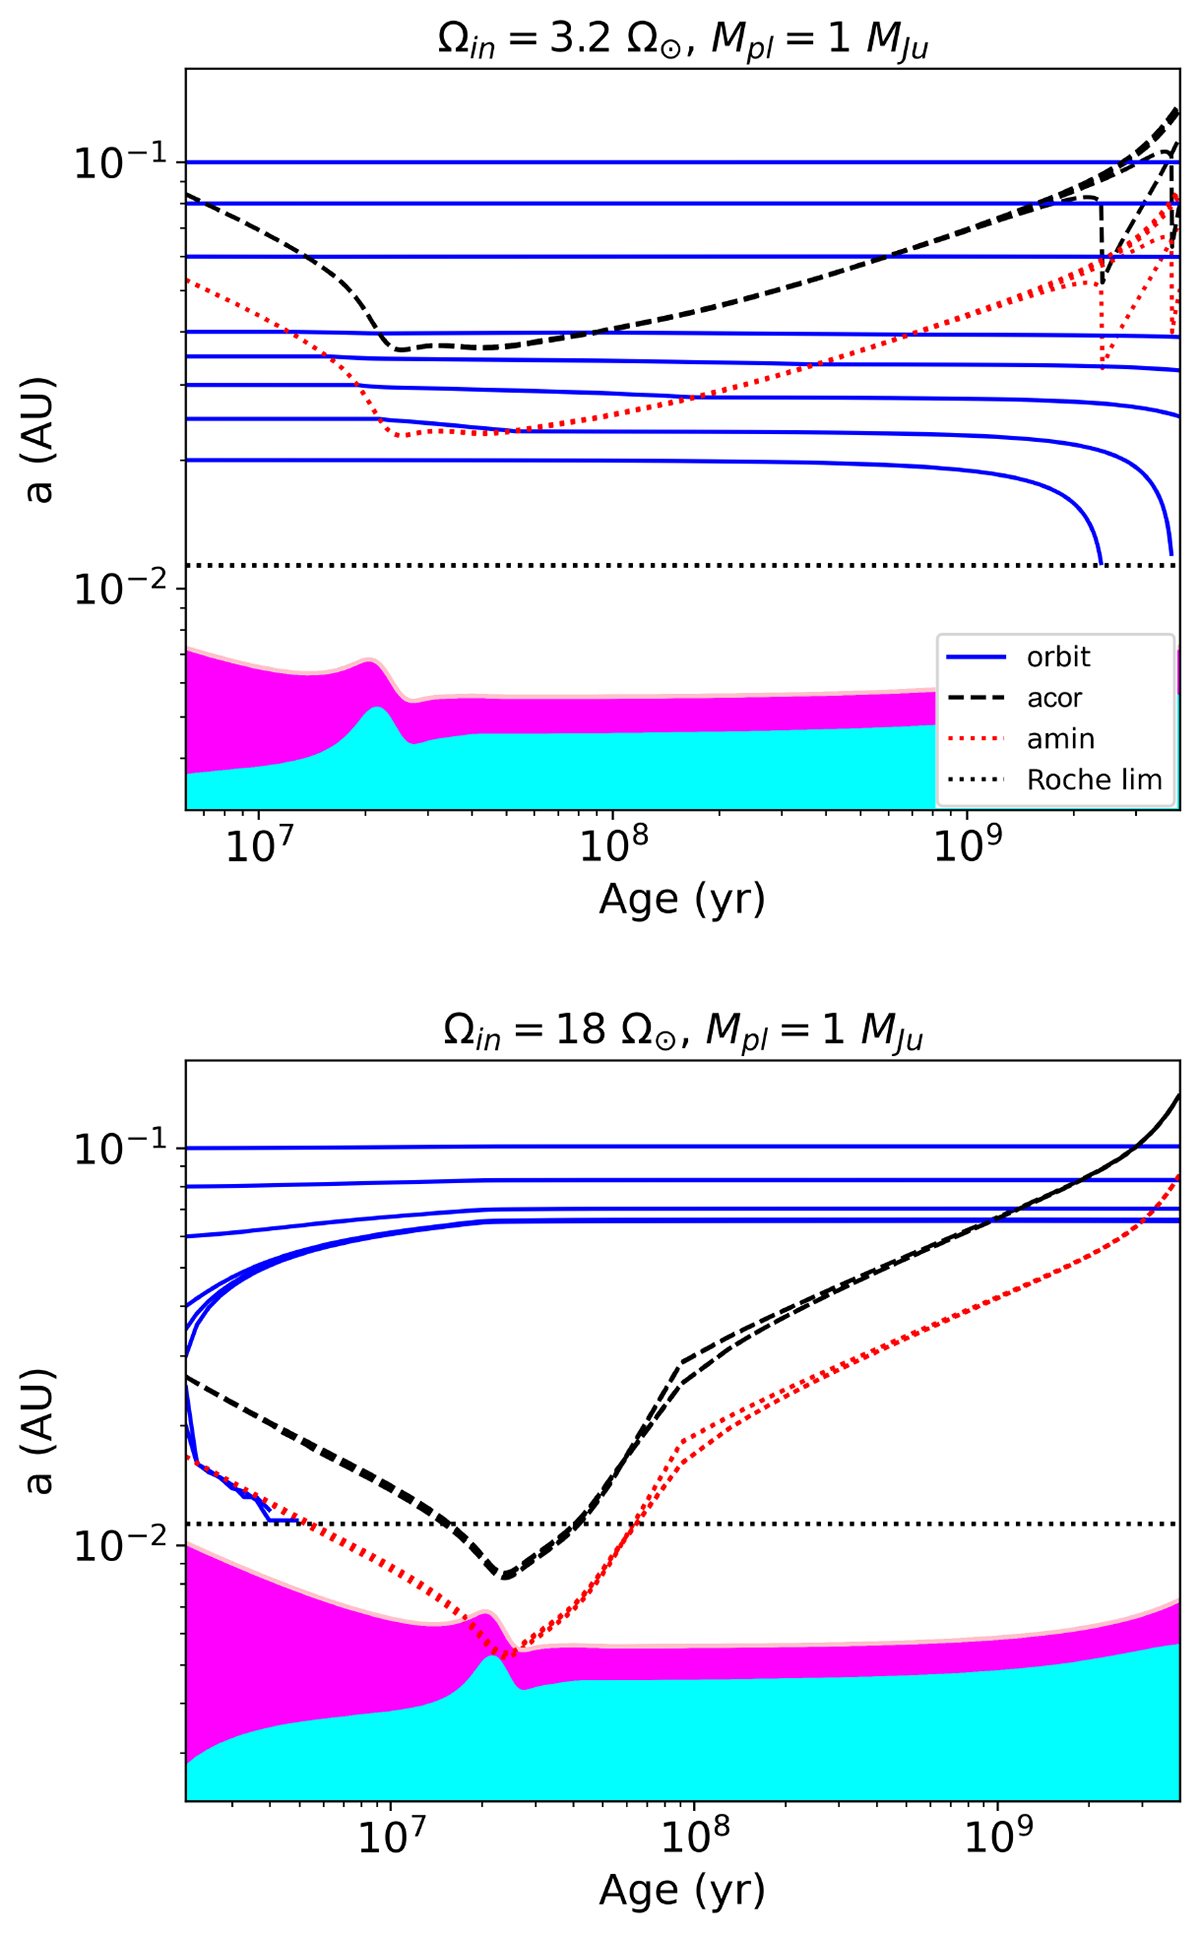
Orbital evolution for 1 MJ planet with 0.02 ≤ ain (AU) ≤ 0.1 and Ωin = 3.2, 18 Ω⊙ (top and bottom panels, respectively). The solid blue lines show the evolution of the orbital distance. The dotted red and dashed black lines indicate the evolution of amin and acor, respectively. The Roche limit is shown by the black dotted line. The cyan and magenta shaded areas represent the extension of the stellar core and envelope along the evolution of the star, respectively.
Current usage metrics show cumulative count of Article Views (full-text article views including HTML views, PDF and ePub downloads, according to the available data) and Abstracts Views on Vision4Press platform.
Data correspond to usage on the plateform after 2015. The current usage metrics is available 48-96 hours after online publication and is updated daily on week days.
Initial download of the metrics may take a while.