Fig. 8.
Download original image
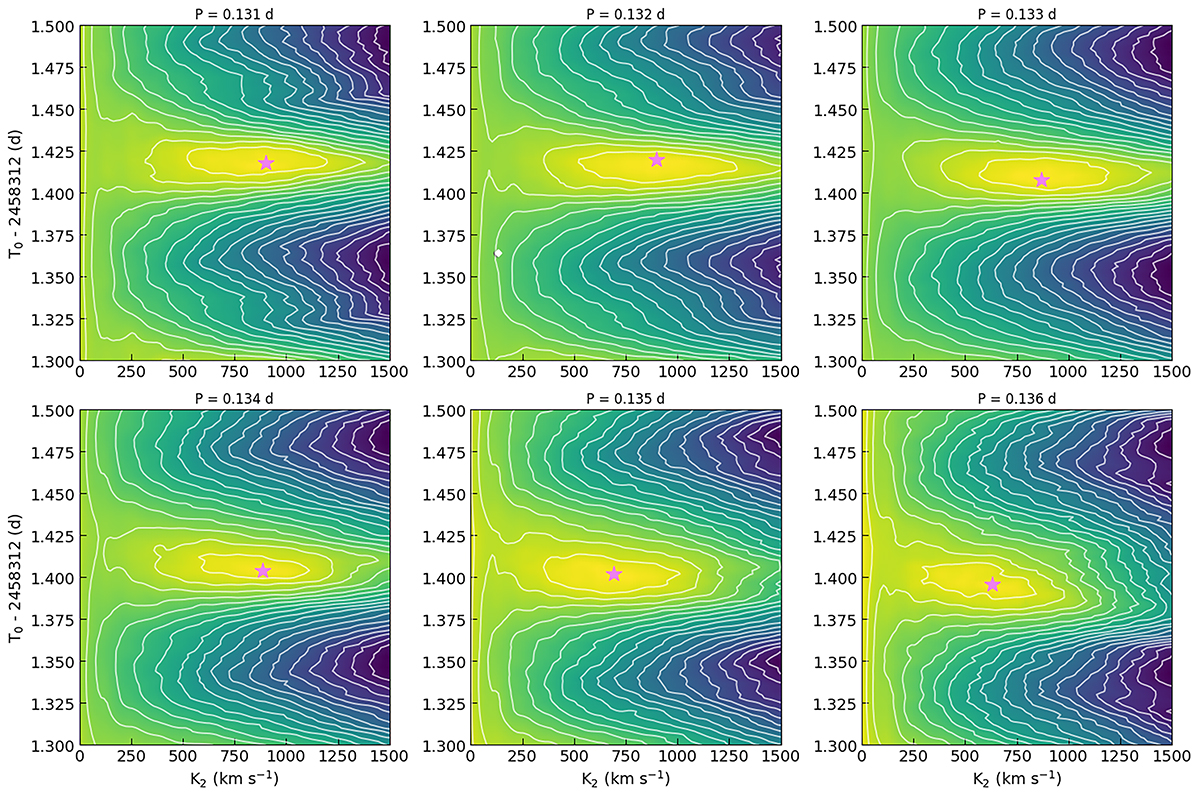
Mosaic of cross-corelation peak values obtained for a range of K2 and T0, and several periods between 0.131–0.136 d. The lightest (yellow colour) regions correspond to the highest cross-correlation values, normalised to the peak (marked with a pink star). Each contour is separated by 0.05 in the normalised scale. The highest cross-correlation peaks are constrained between T0(HJD) = 2458313.40 − 2458313.42 d and K2 = 650 − 950 km s−1. For periods outside the plotted range, the contours become noisier and more distorted.
Current usage metrics show cumulative count of Article Views (full-text article views including HTML views, PDF and ePub downloads, according to the available data) and Abstracts Views on Vision4Press platform.
Data correspond to usage on the plateform after 2015. The current usage metrics is available 48-96 hours after online publication and is updated daily on week days.
Initial download of the metrics may take a while.