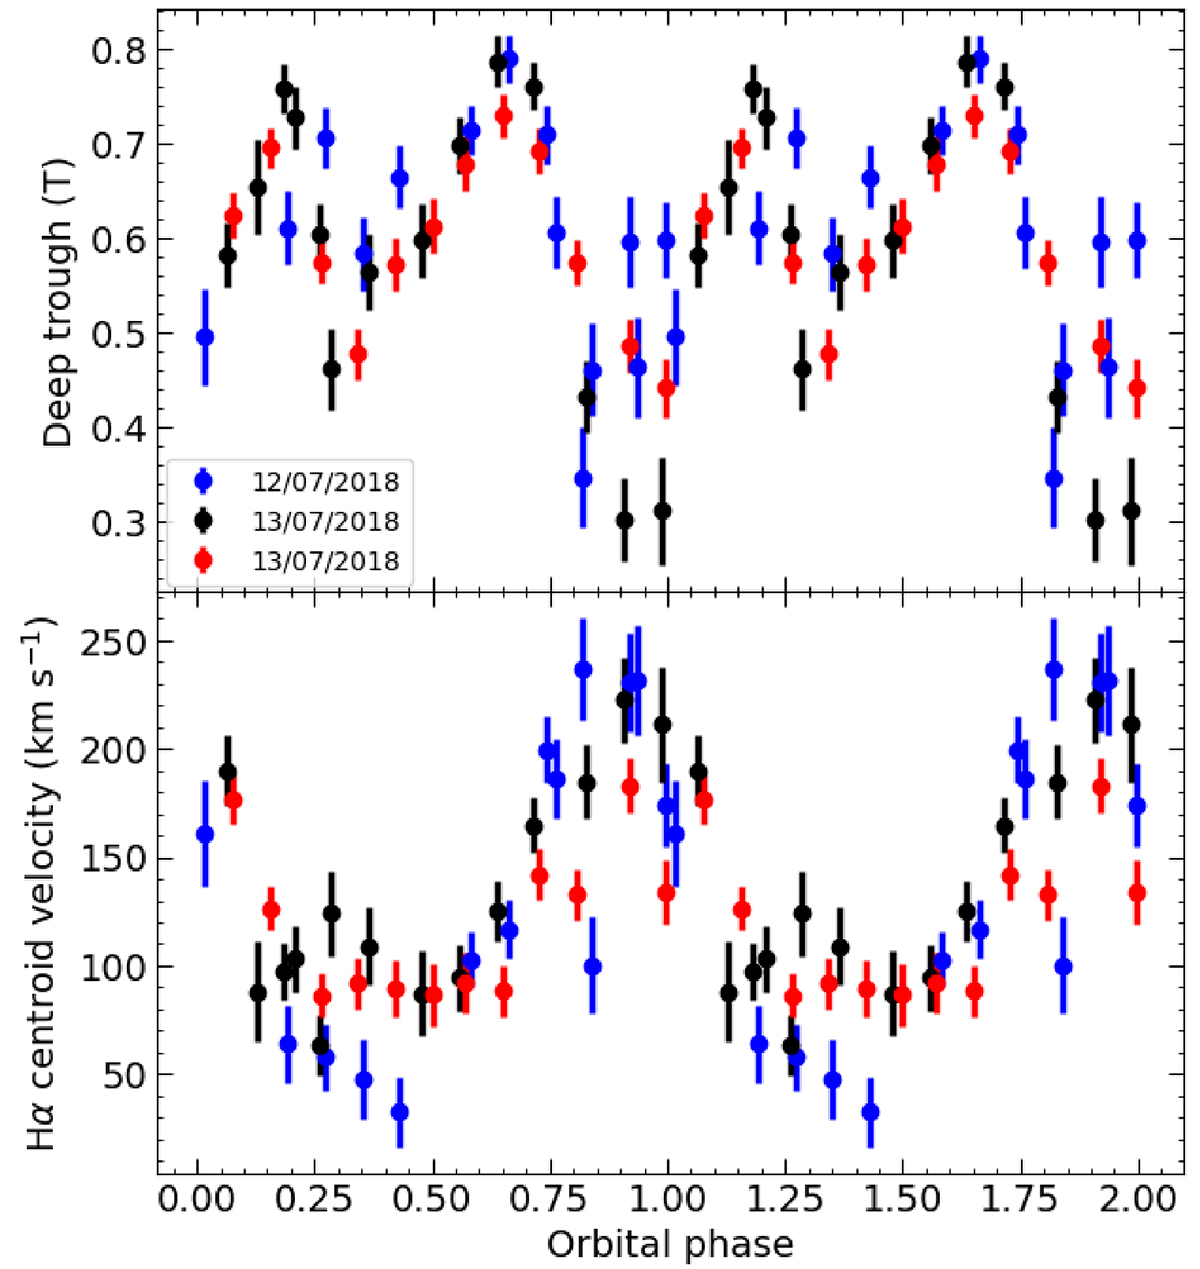
Fig. 7.
Download original image
Orbital evolution of T (top panel) and the Hα centroid velocities (bottom panel). The curves have been folded using our spectroscopic orbital period 3.26 ± 0.02 h and a tentative T0(HJD) = 2458313.41 ± 0.05 d, obtained by imposing that the deepest minima in the depth of the trough T are centred at phase 0.95. For the sake of clarity, one orbital cycle is repeated. The T curve shows a double-humped morphology with the orbital period.
Current usage metrics show cumulative count of Article Views (full-text article views including HTML views, PDF and ePub downloads, according to the available data) and Abstracts Views on Vision4Press platform.
Data correspond to usage on the plateform after 2015. The current usage metrics is available 48-96 hours after online publication and is updated daily on week days.
Initial download of the metrics may take a while.