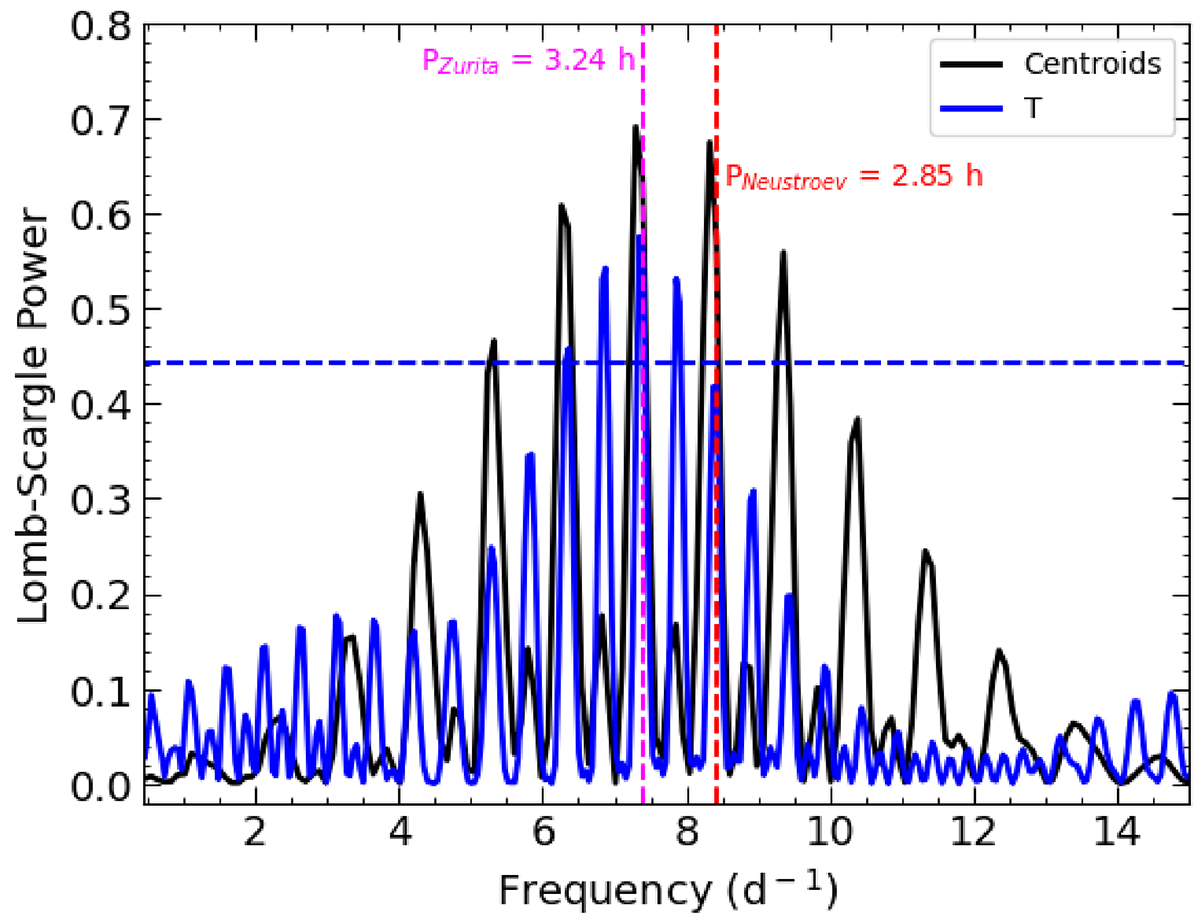
Fig. 6.
Download original image
Lomb-Scargle periodograms obtained from the variability of the double peak trough T (blue) and the Hα emission line centroid velocities (black). For comparison purposes, and due to the double-humped nature of the T modulation, we halved the frequencies corresponding to the periodogram associated with T. The horizontal black line shows the 99% white noise significance level. The pink and red vertical dashed lines mark the potential orbital periods found by Zurita et al. (2008) and Neustroev et al. (2014), respectively.
Current usage metrics show cumulative count of Article Views (full-text article views including HTML views, PDF and ePub downloads, according to the available data) and Abstracts Views on Vision4Press platform.
Data correspond to usage on the plateform after 2015. The current usage metrics is available 48-96 hours after online publication and is updated daily on week days.
Initial download of the metrics may take a while.