Fig. 1
Download original image
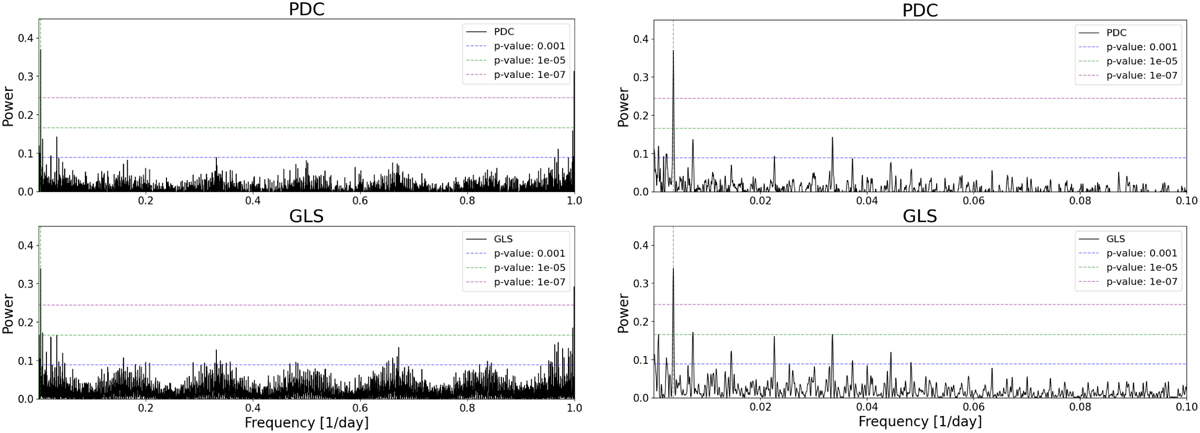
PDC (top left) and GLS (bottom left) periodograms for the RV data. Also shown are the periodograms with a narrower frequency range – PDC (top right) and GLS (bottom right). The horizontal dotted lines indicate the corresponding p-values as noted in the legend. The vertical green dotted line in each periodogram marks the detected period of 273.22 days.
Current usage metrics show cumulative count of Article Views (full-text article views including HTML views, PDF and ePub downloads, according to the available data) and Abstracts Views on Vision4Press platform.
Data correspond to usage on the plateform after 2015. The current usage metrics is available 48-96 hours after online publication and is updated daily on week days.
Initial download of the metrics may take a while.