Open Access
Fig. 5.
Download original image
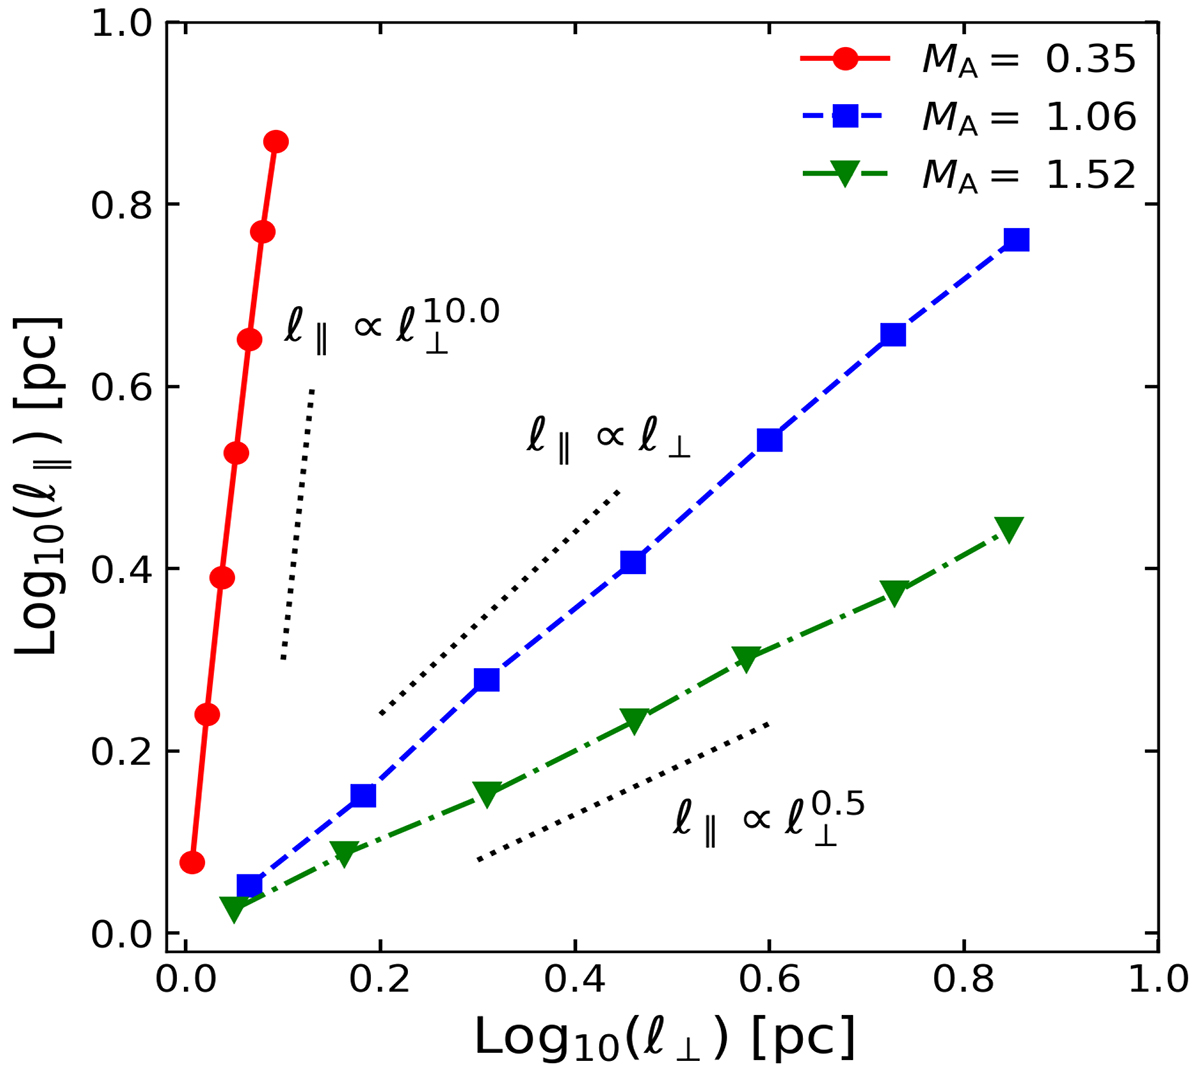
Anisotropy scalings of the projected energy density ∫UCRdz in xy plane, where the red-circle, blue-square, and green-triangle symbols are obtained by panels a, b, and c of Fig. 4, respectively. Here, l∥ and l⊥ represent the parallel (x axis) and perpendicular (y axis) scales of the morphology, respectively.
Current usage metrics show cumulative count of Article Views (full-text article views including HTML views, PDF and ePub downloads, according to the available data) and Abstracts Views on Vision4Press platform.
Data correspond to usage on the plateform after 2015. The current usage metrics is available 48-96 hours after online publication and is updated daily on week days.
Initial download of the metrics may take a while.