Open Access
Fig. 3.
Download original image
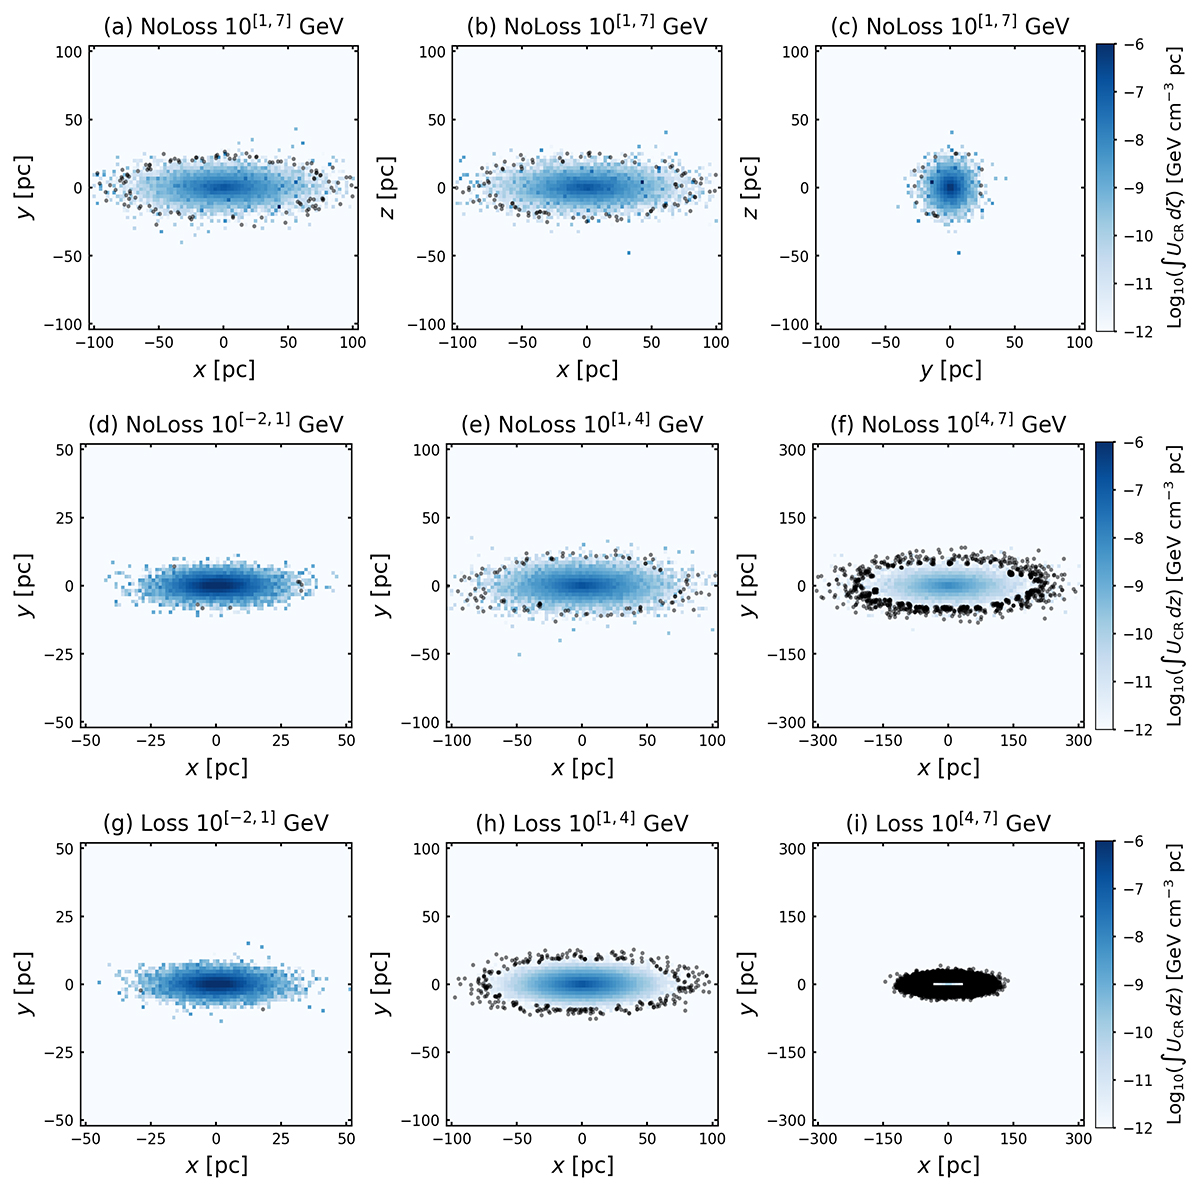
Projected energy density ∫UCR dζ in xy, xz, and yz planes. The energy density denoted by the color bars is limited in the range of 10−12 − 10−6 GeV cm−3 pc. The black points show the positions of individual CR particles in the regions where the energy density falls below the range shown by the color bars.
Current usage metrics show cumulative count of Article Views (full-text article views including HTML views, PDF and ePub downloads, according to the available data) and Abstracts Views on Vision4Press platform.
Data correspond to usage on the plateform after 2015. The current usage metrics is available 48-96 hours after online publication and is updated daily on week days.
Initial download of the metrics may take a while.