Fig. 1.
Download original image
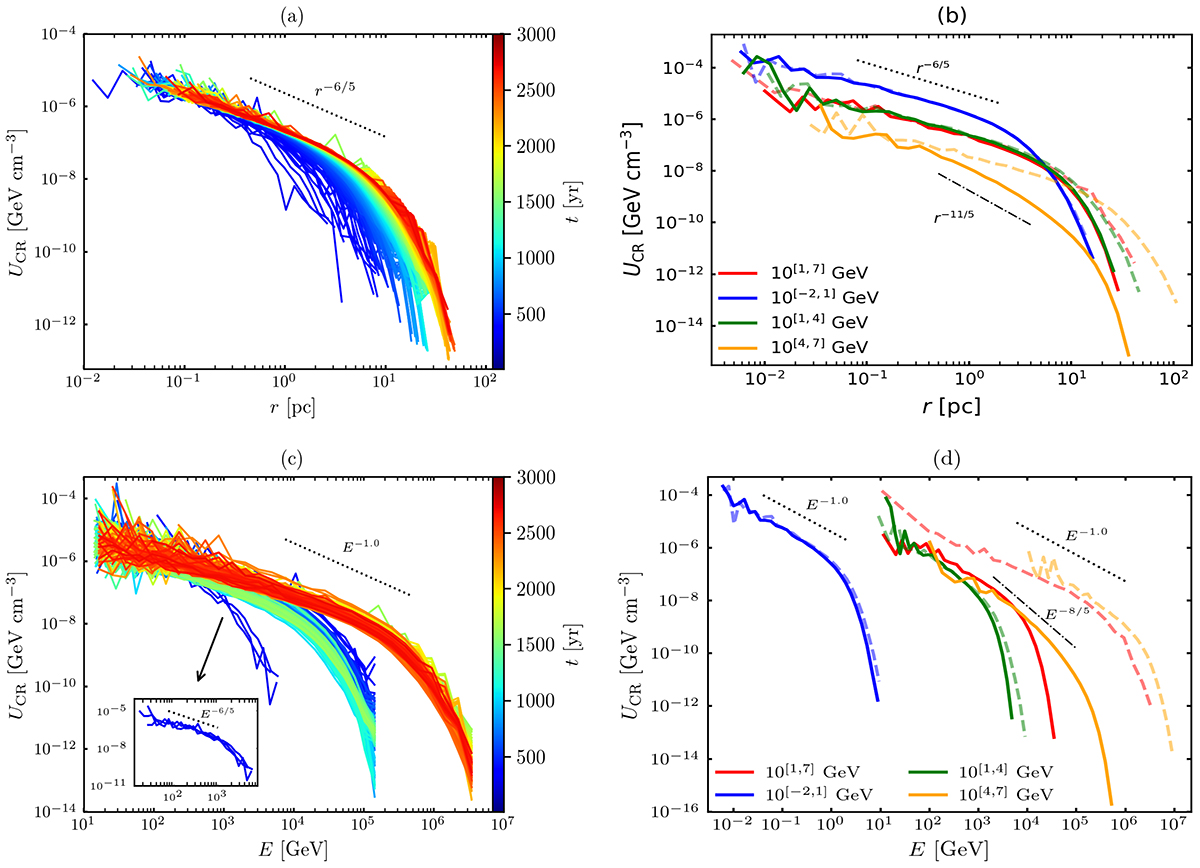
Energy density UCR as a function of the particles’ effective radius r (upper row) and kinetic energy E (lower row). Left column: the time-dependent evolution of UCR corresponds to the no loss case of E ∈ 10[1, 7] GeV, where the color bar shows the simulation time in units of yr. In panel (c), the UCR distribution of the several initial snapshots is shown in the inset. Right column: UCR distributions in four different energy regimes plotted at the final snapshot (t = 3 kyr), where the dashed and solid lines show the results without and with loss processes, respectively. Simulations are based on the related parameters in Group 𝒜.
Current usage metrics show cumulative count of Article Views (full-text article views including HTML views, PDF and ePub downloads, according to the available data) and Abstracts Views on Vision4Press platform.
Data correspond to usage on the plateform after 2015. The current usage metrics is available 48-96 hours after online publication and is updated daily on week days.
Initial download of the metrics may take a while.