Fig. 6
Download original image
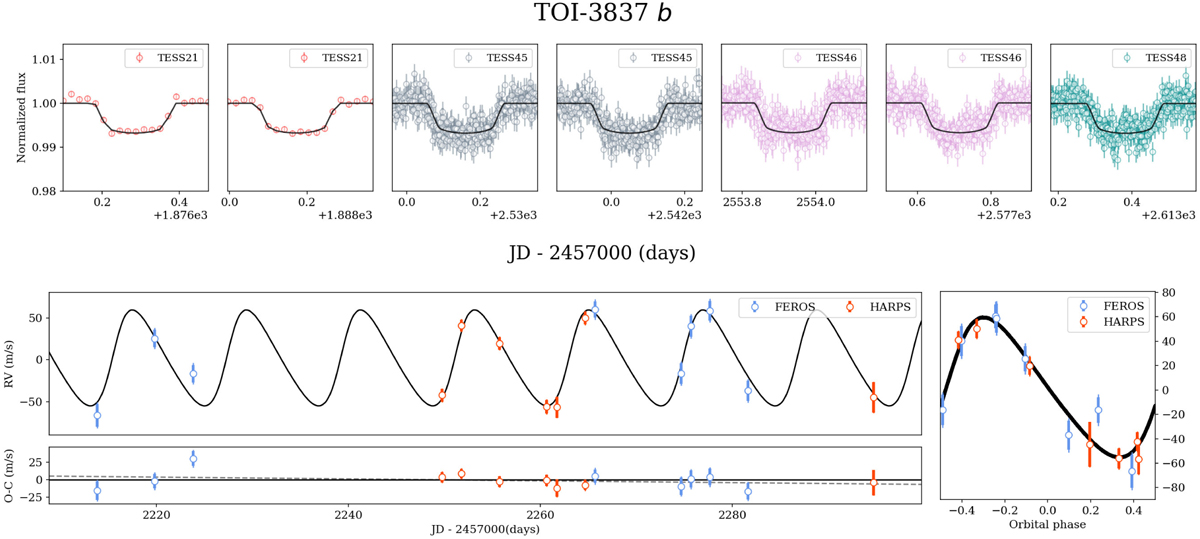
Light curves and RV data of TOI 3837. We show the best juliet joint-fit model in black. FEROS RVs are shown in blue and HARPS RVs are shown in red. The top panel shows the TESS light curves, the bottom left panel shows the RV time series, and the bottom right panel shows the RV phase-folded data. The black line in the O-C of the RV time series is centered around zero to compare with the RV residuals after the best-fit model substraction.
Current usage metrics show cumulative count of Article Views (full-text article views including HTML views, PDF and ePub downloads, according to the available data) and Abstracts Views on Vision4Press platform.
Data correspond to usage on the plateform after 2015. The current usage metrics is available 48-96 hours after online publication and is updated daily on week days.
Initial download of the metrics may take a while.