Open Access
Fig. A.2
Download original image
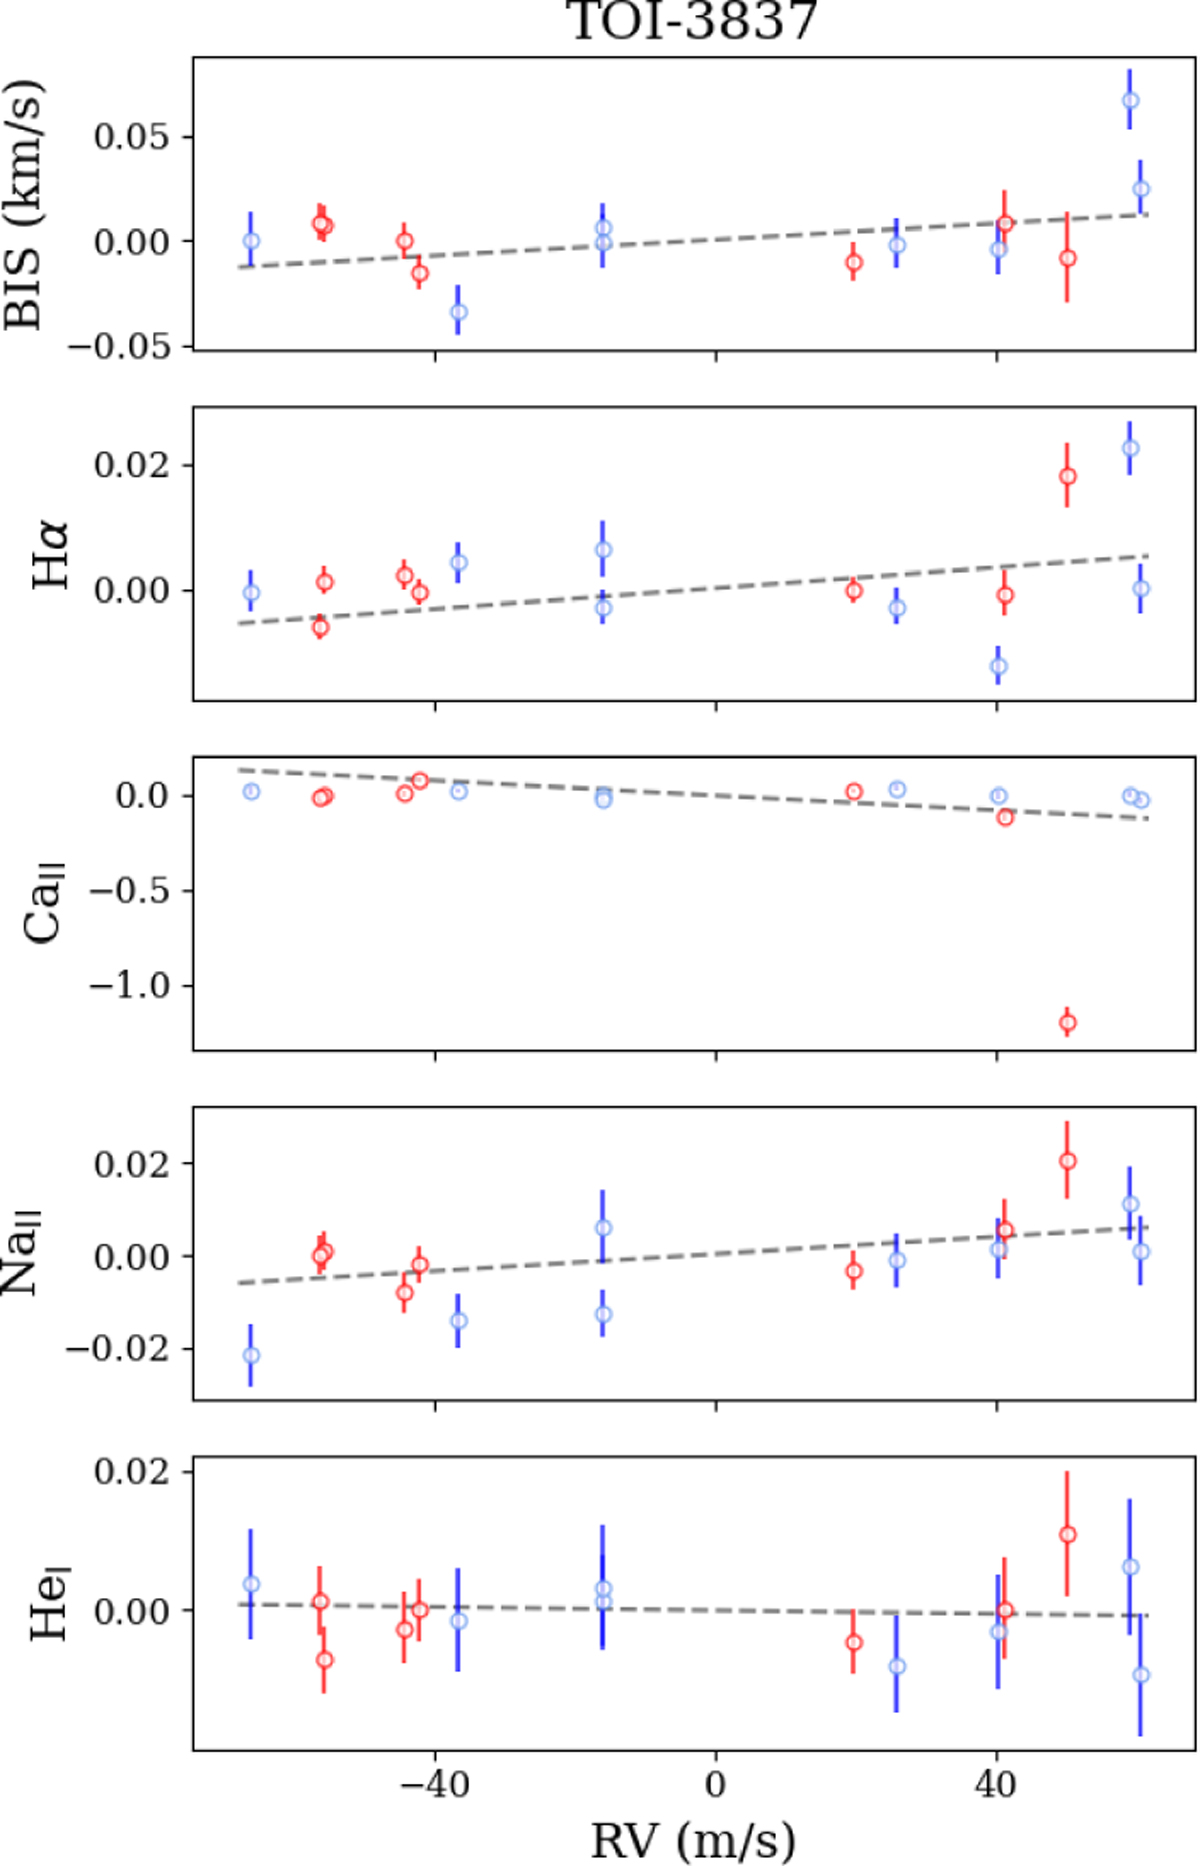
Stellar activity indices plotted as a function of the RV for TOI 3837. The gray dashed line show the best linear fit to the data. The red points correspond to HARPS measurements and the blue points correspond to FEROS measurements.
Current usage metrics show cumulative count of Article Views (full-text article views including HTML views, PDF and ePub downloads, according to the available data) and Abstracts Views on Vision4Press platform.
Data correspond to usage on the plateform after 2015. The current usage metrics is available 48-96 hours after online publication and is updated daily on week days.
Initial download of the metrics may take a while.