Open Access
Fig. 13.
Download original image
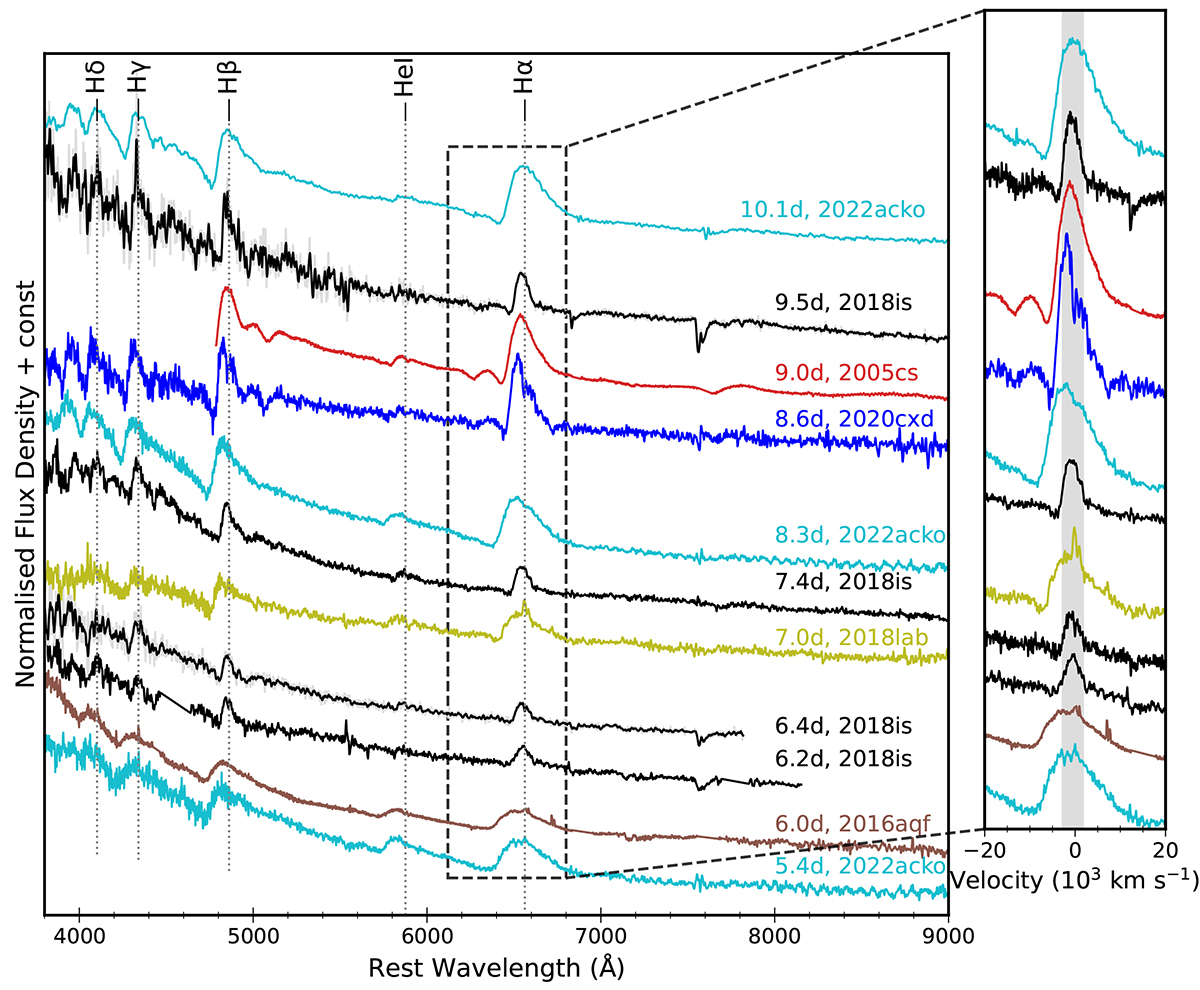
Early spectra of SN 2018is are compared to spectra of other LLSNe II at similar epochs. The right panel shows the Hα region in velocity space, with the shaded area representing twice the FWHM of the Hα line for SN 2018is.
Current usage metrics show cumulative count of Article Views (full-text article views including HTML views, PDF and ePub downloads, according to the available data) and Abstracts Views on Vision4Press platform.
Data correspond to usage on the plateform after 2015. The current usage metrics is available 48-96 hours after online publication and is updated daily on week days.
Initial download of the metrics may take a while.