Fig. 1
Download original image
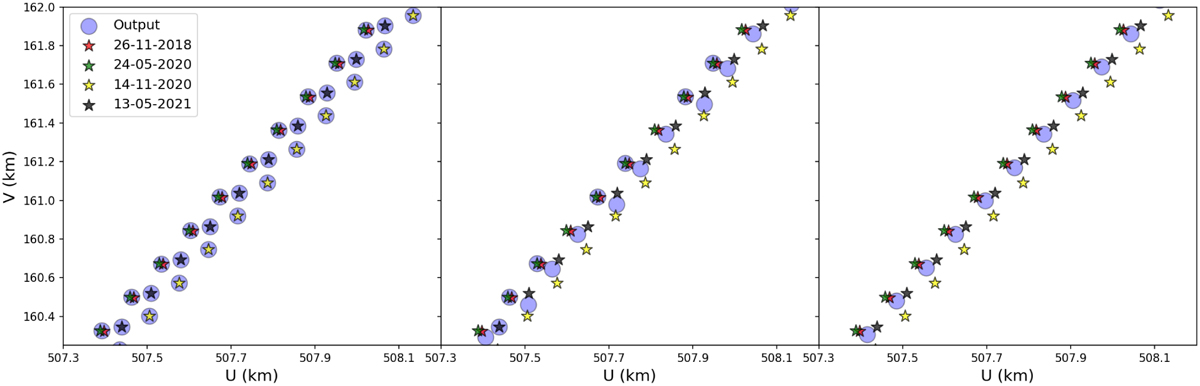
Different uv samplings for one baseline with length 594 km between a Dutch core station (CS001HBA) and the Swedish LOFAR station at Onsala Space Observatory (SE607HBA). The input datasets are represented by red, green, yellow, and black stars and labelled by their observing dates. The output dataset is represented by blue dots. The input data has a time resolution of 8 seconds. Left panel: output time sampling at Δt = 1 second. Centre panel: output time sampling according to Equation (1) at Δt = 3.6 seconds. Right panel: output time sampling at Δt = 8 seconds.
Current usage metrics show cumulative count of Article Views (full-text article views including HTML views, PDF and ePub downloads, according to the available data) and Abstracts Views on Vision4Press platform.
Data correspond to usage on the plateform after 2015. The current usage metrics is available 48-96 hours after online publication and is updated daily on week days.
Initial download of the metrics may take a while.