Open Access
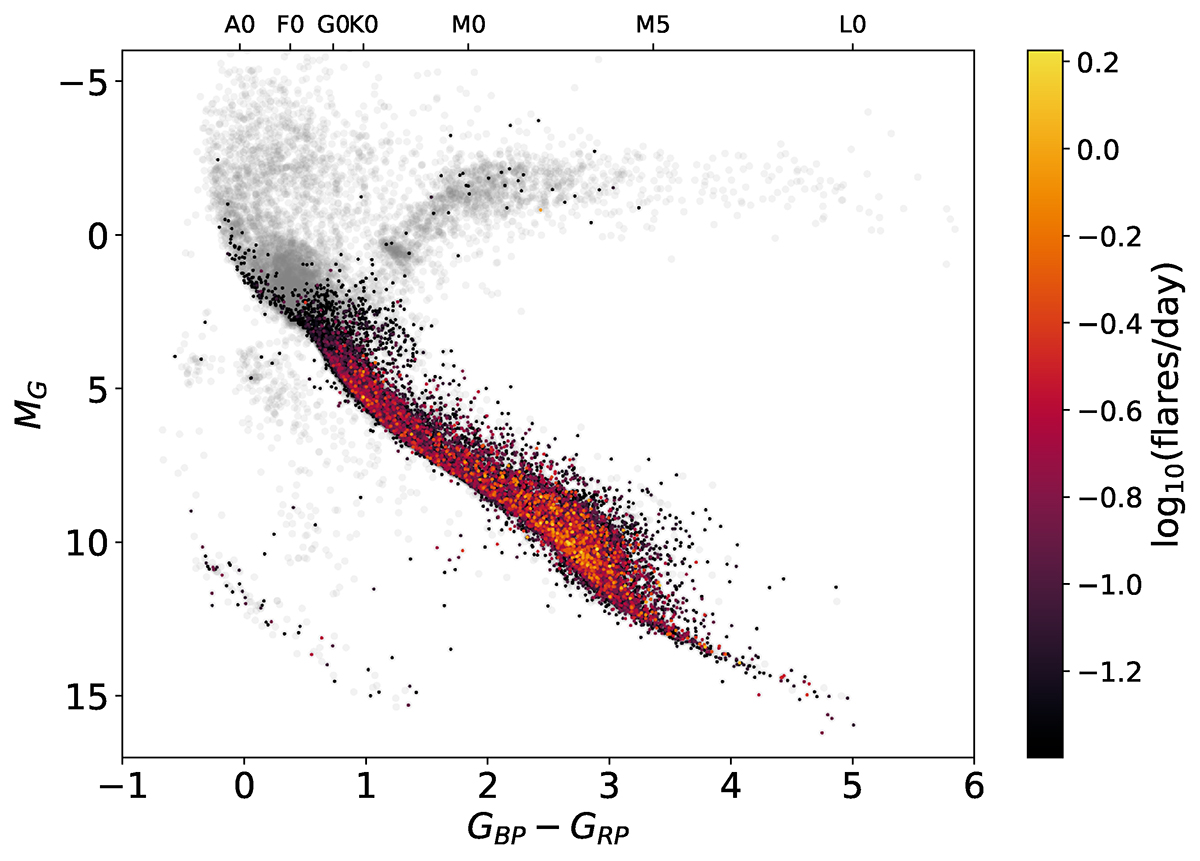
Fig. 7.
Download original image
Flaring stars on the Gaia color-magnitude diagram colored with the flare rate. We note that the stars are plotted in order of their flare rates to show the most active stars on top. Gray points show all the stars prior to manual vetting (Sect. 2.5) in order to make the position of the red giant branch more discernible.
Current usage metrics show cumulative count of Article Views (full-text article views including HTML views, PDF and ePub downloads, according to the available data) and Abstracts Views on Vision4Press platform.
Data correspond to usage on the plateform after 2015. The current usage metrics is available 48-96 hours after online publication and is updated daily on week days.
Initial download of the metrics may take a while.