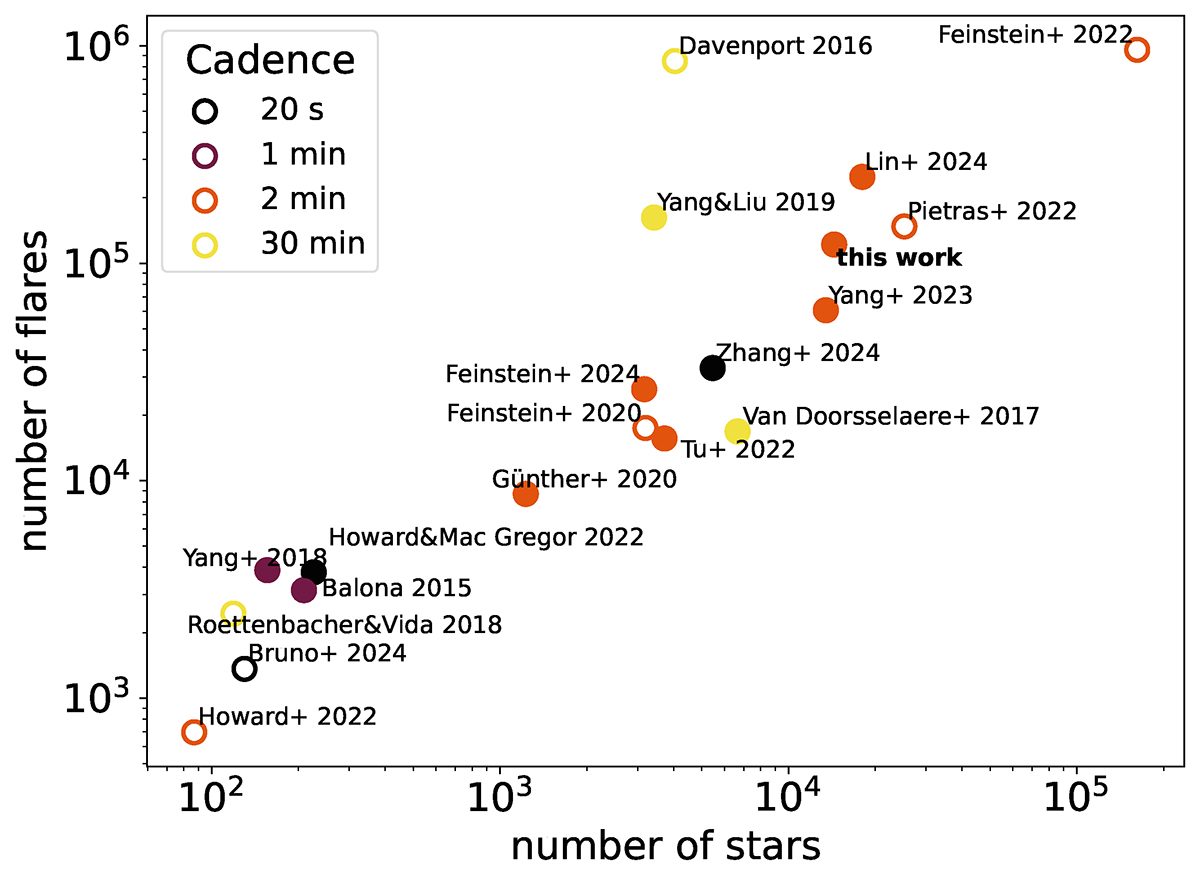
Fig. 6.

Download original image
Sample size comparison between different stellar flare catalogs created from Kepler and TESS data. The color indicates the observing cadence. Filled circles are catalogs that are publicly available. The following catalogs are shown: Balona (2015), Davenport (2016), Van Doorsselaere et al. (2017), Roettenbacher & Vida (2018), Yang et al. (2018), Yang & Liu (2019), Feinstein et al. (2020b, 2022, 2024), Günther et al. (2020), Howard (2022), Howard & MacGregor (2022), Pietras et al. (2022), Tu et al. (2022), Yang et al. (2023b), Bruno et al. (2024), Lin et al. (2024), Zhang et al. (2024).
Current usage metrics show cumulative count of Article Views (full-text article views including HTML views, PDF and ePub downloads, according to the available data) and Abstracts Views on Vision4Press platform.
Data correspond to usage on the plateform after 2015. The current usage metrics is available 48-96 hours after online publication and is updated daily on week days.
Initial download of the metrics may take a while.


