Fig. 3.
Download original image
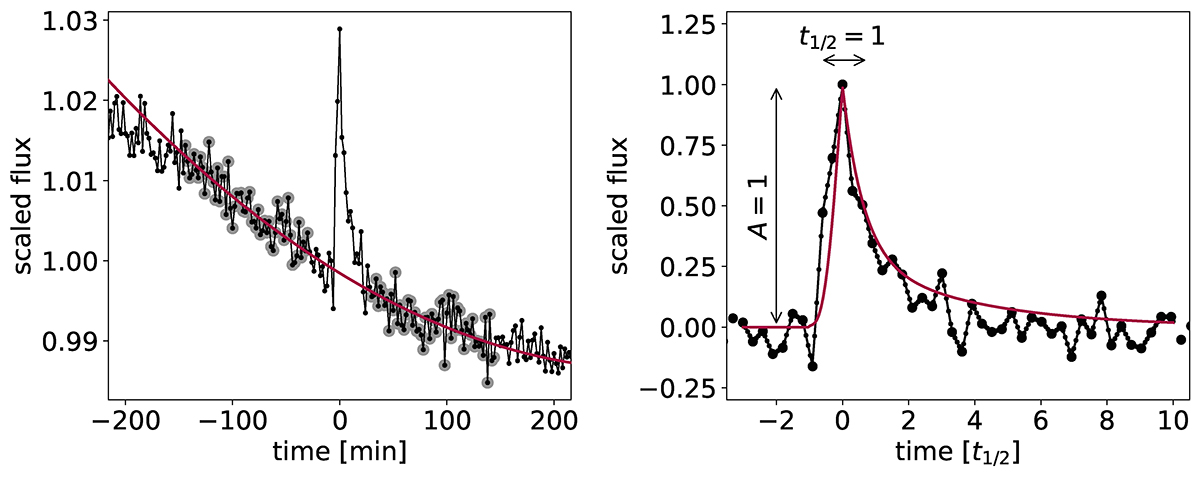
Illustrative example of the extraction of a scaled flare shape. Left: Light curve segment around the flare. Gray shows the points used for the baseline fit; the red line shows the fitted polynomial. Right: Scaled flare shape. The red line shows the flare template used for the time scaling. The large black dots are from the original light curve; the small black dots are the interpolated points.
Current usage metrics show cumulative count of Article Views (full-text article views including HTML views, PDF and ePub downloads, according to the available data) and Abstracts Views on Vision4Press platform.
Data correspond to usage on the plateform after 2015. The current usage metrics is available 48-96 hours after online publication and is updated daily on week days.
Initial download of the metrics may take a while.