Open Access
Fig. 17.
Download original image
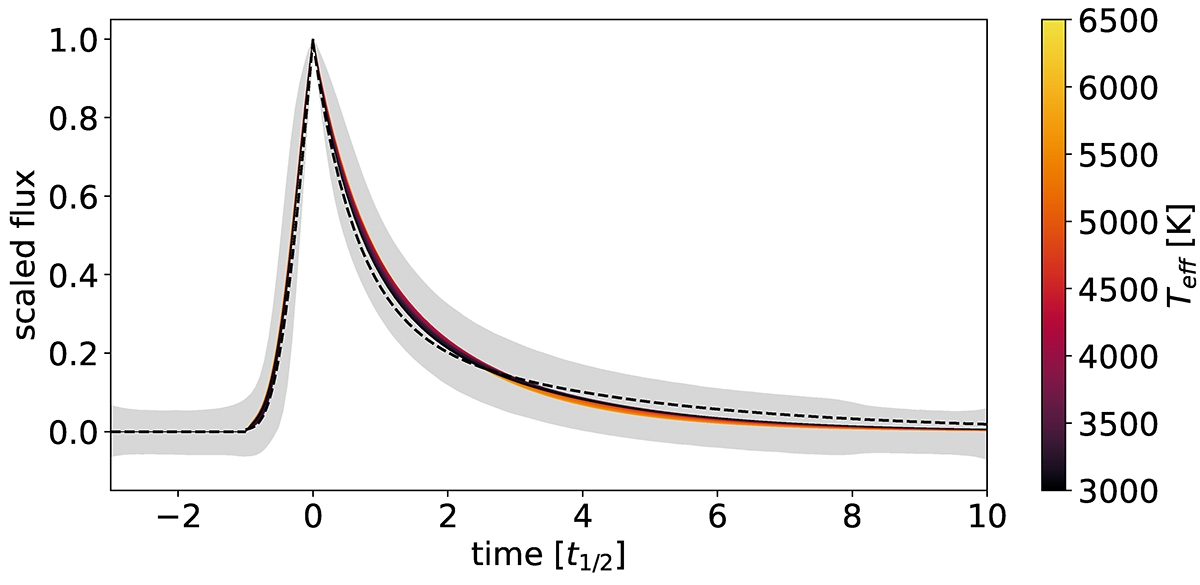
Flare templates fitted along the MS using Eq. (9)–(10) and color coded with Teff. The shaded region shows the 16th and 84th percentiles of the dataset. The black dashed line shows the template of Davenport et al. (2014).
Current usage metrics show cumulative count of Article Views (full-text article views including HTML views, PDF and ePub downloads, according to the available data) and Abstracts Views on Vision4Press platform.
Data correspond to usage on the plateform after 2015. The current usage metrics is available 48-96 hours after online publication and is updated daily on week days.
Initial download of the metrics may take a while.