Fig. 15.
Download original image
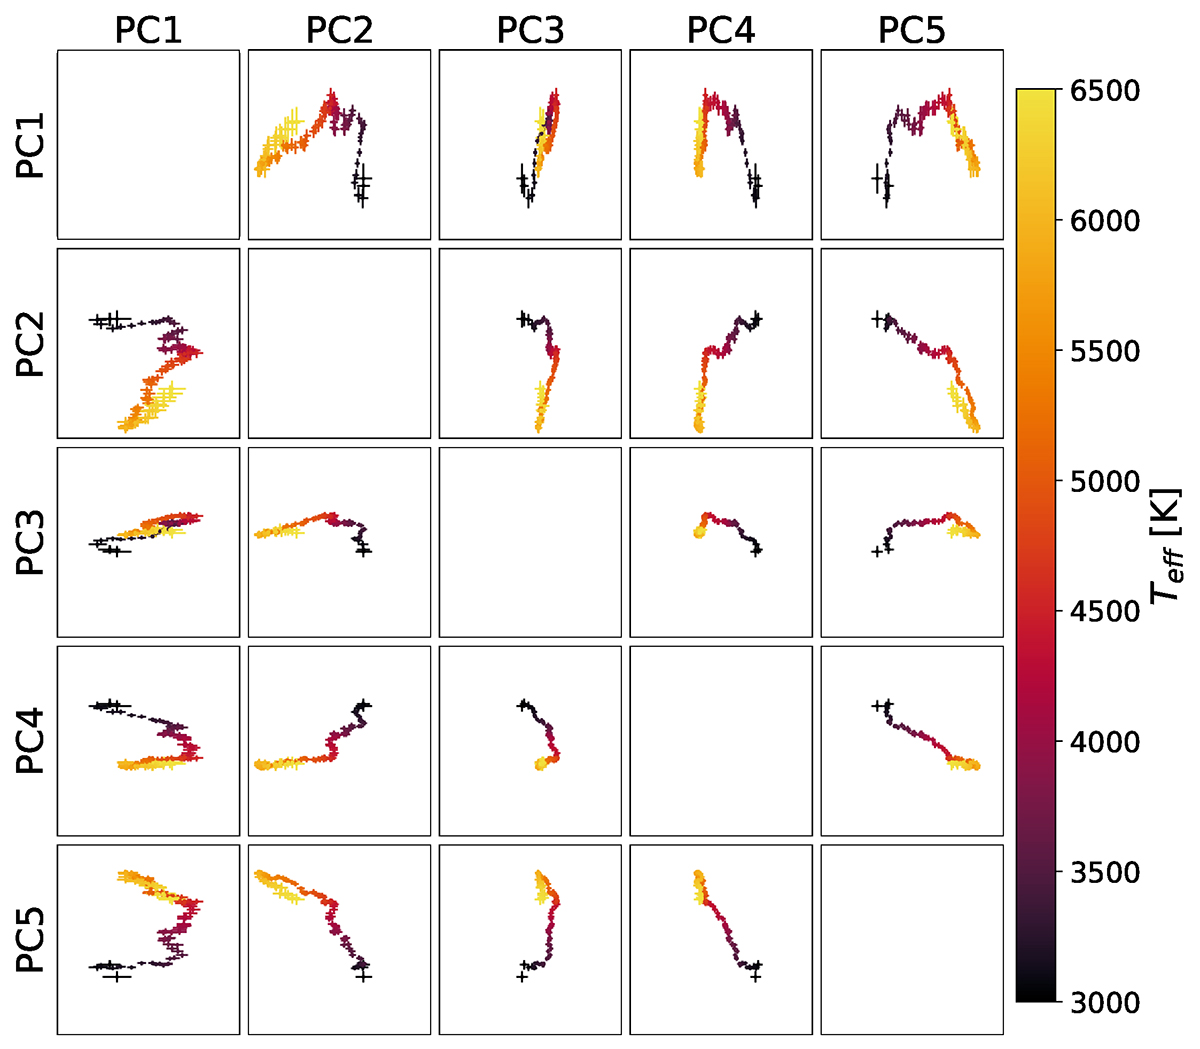
Changes in the flare shapes in the PC space along the MS. The points denote the median value of the PC coefficients for the stars in the given bins from Fig. 9, colored with Teff. The error bars show the standard error of the median, ![]() times the standard deviation (assuming roughly normal distributions). In each subpanel, only the inner 10% of the range from Fig. 12 is shown.
times the standard deviation (assuming roughly normal distributions). In each subpanel, only the inner 10% of the range from Fig. 12 is shown.
Current usage metrics show cumulative count of Article Views (full-text article views including HTML views, PDF and ePub downloads, according to the available data) and Abstracts Views on Vision4Press platform.
Data correspond to usage on the plateform after 2015. The current usage metrics is available 48-96 hours after online publication and is updated daily on week days.
Initial download of the metrics may take a while.