Open Access
Fig. 14.
Download original image
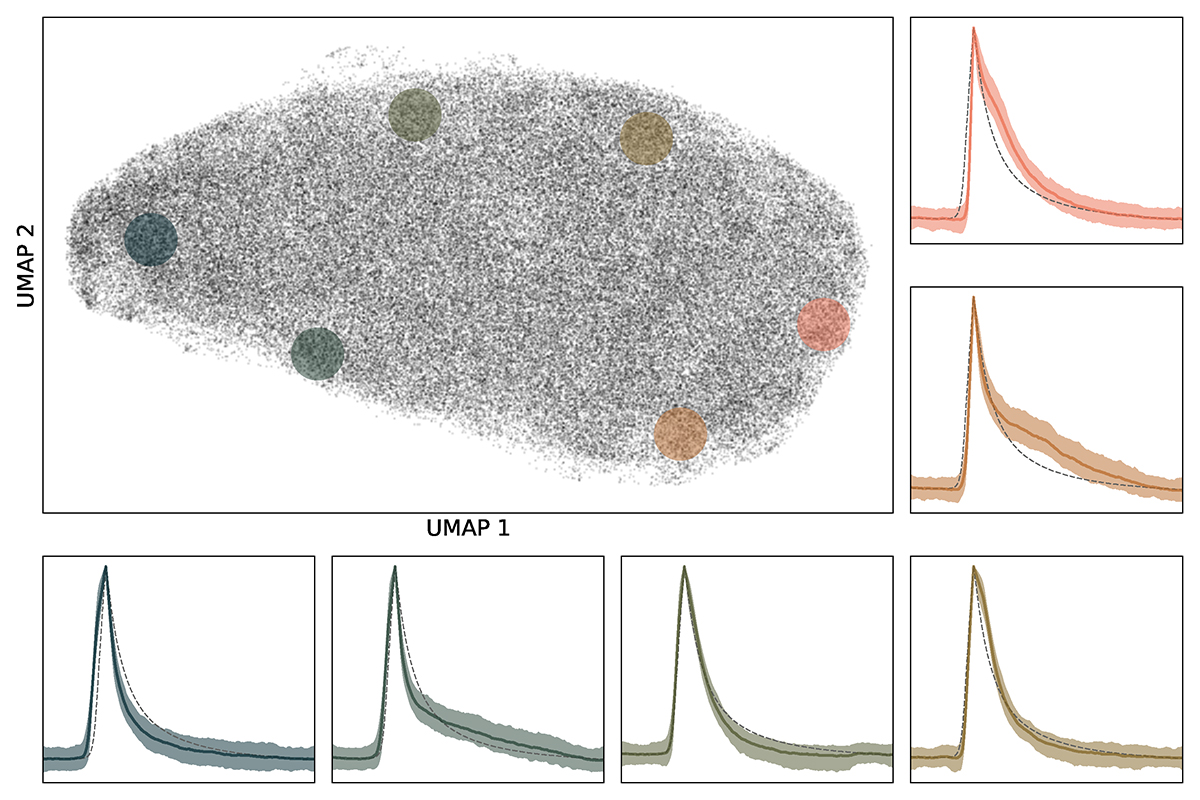
Average flare shapes from different positions in the UMAP space. Different colors show the median profiles and the range between the 16th and 84th percentiles inside the given circles in the UMAP space. Each circle includes approximately 1000 flares. Dashed lines in the subplots show the whole sample median for comparison.
Current usage metrics show cumulative count of Article Views (full-text article views including HTML views, PDF and ePub downloads, according to the available data) and Abstracts Views on Vision4Press platform.
Data correspond to usage on the plateform after 2015. The current usage metrics is available 48-96 hours after online publication and is updated daily on week days.
Initial download of the metrics may take a while.