Open Access
Fig. 12.
Download original image
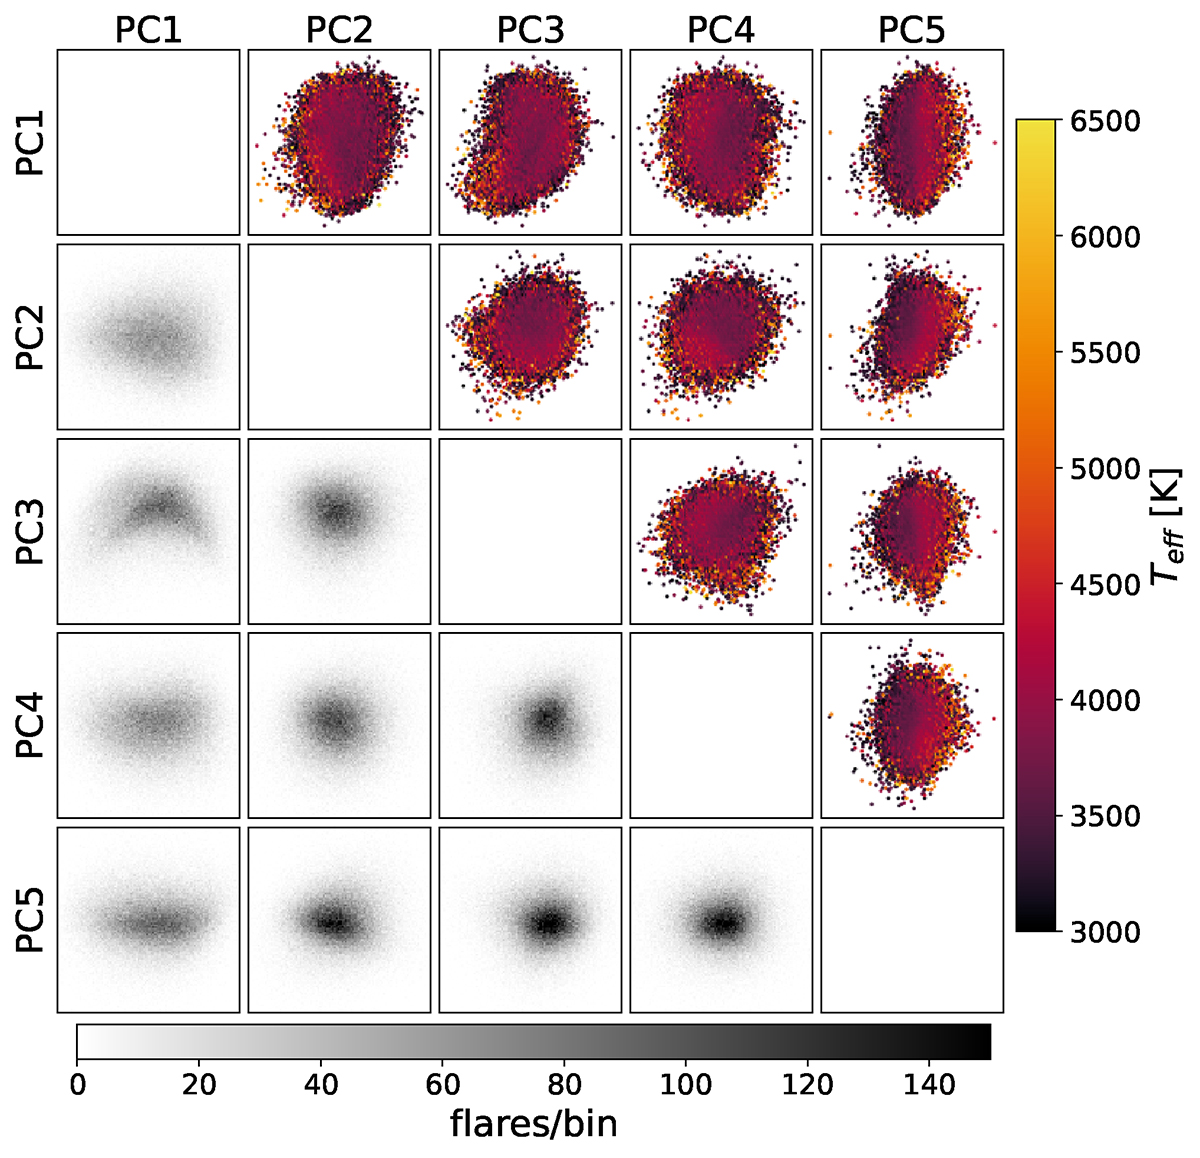
Distribution of flares in the PC space. Each panel shows a two-dimensional histogram. Below the diagonal, the shading indicates the number density of flares. Above the diagonal, the color code indicates the average Teff from TICv8.2 in each bin. The Teff dependence is most apparent in PC5.
Current usage metrics show cumulative count of Article Views (full-text article views including HTML views, PDF and ePub downloads, according to the available data) and Abstracts Views on Vision4Press platform.
Data correspond to usage on the plateform after 2015. The current usage metrics is available 48-96 hours after online publication and is updated daily on week days.
Initial download of the metrics may take a while.