Fig. 14
Download original image
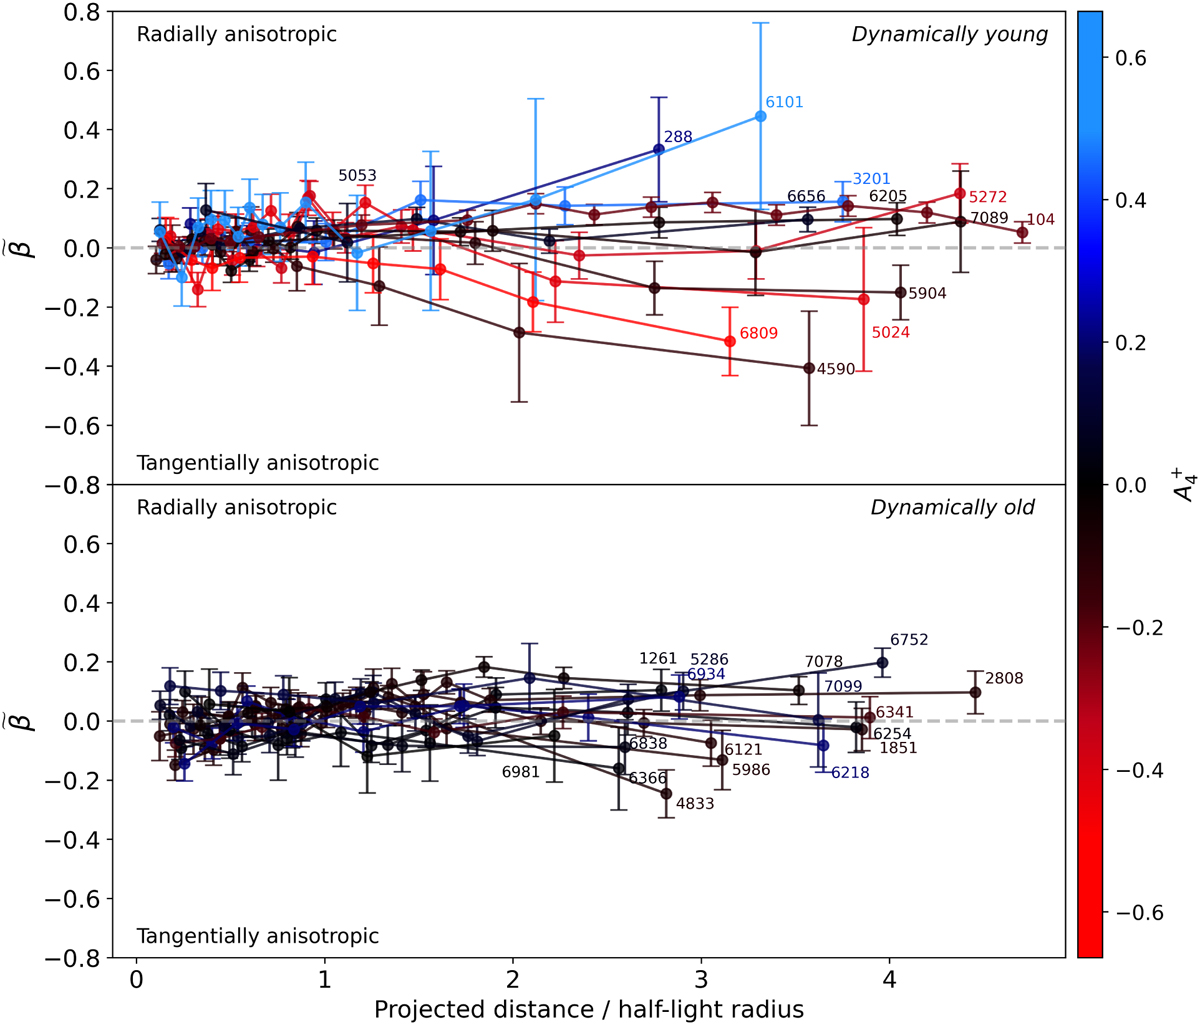
Normalised anisotropy of the dynamically youngest GCs in the sample (age/Trh < 4.5) (top) and the dynamically old clusters (age/Trh > 4.5) (bottom) as a function of the projected distance normalised by the half-light radius of each cluster. Each cluster is colour-coded by its A+ parameter, as calculated in Leitinger et al. (2023). Clusters in blue (red) are shown to have P1(P2) more centrally concentrated, while clusters in black have spatially mixed populations.
Current usage metrics show cumulative count of Article Views (full-text article views including HTML views, PDF and ePub downloads, according to the available data) and Abstracts Views on Vision4Press platform.
Data correspond to usage on the plateform after 2015. The current usage metrics is available 48-96 hours after online publication and is updated daily on week days.
Initial download of the metrics may take a while.