Fig. 5
Download original image
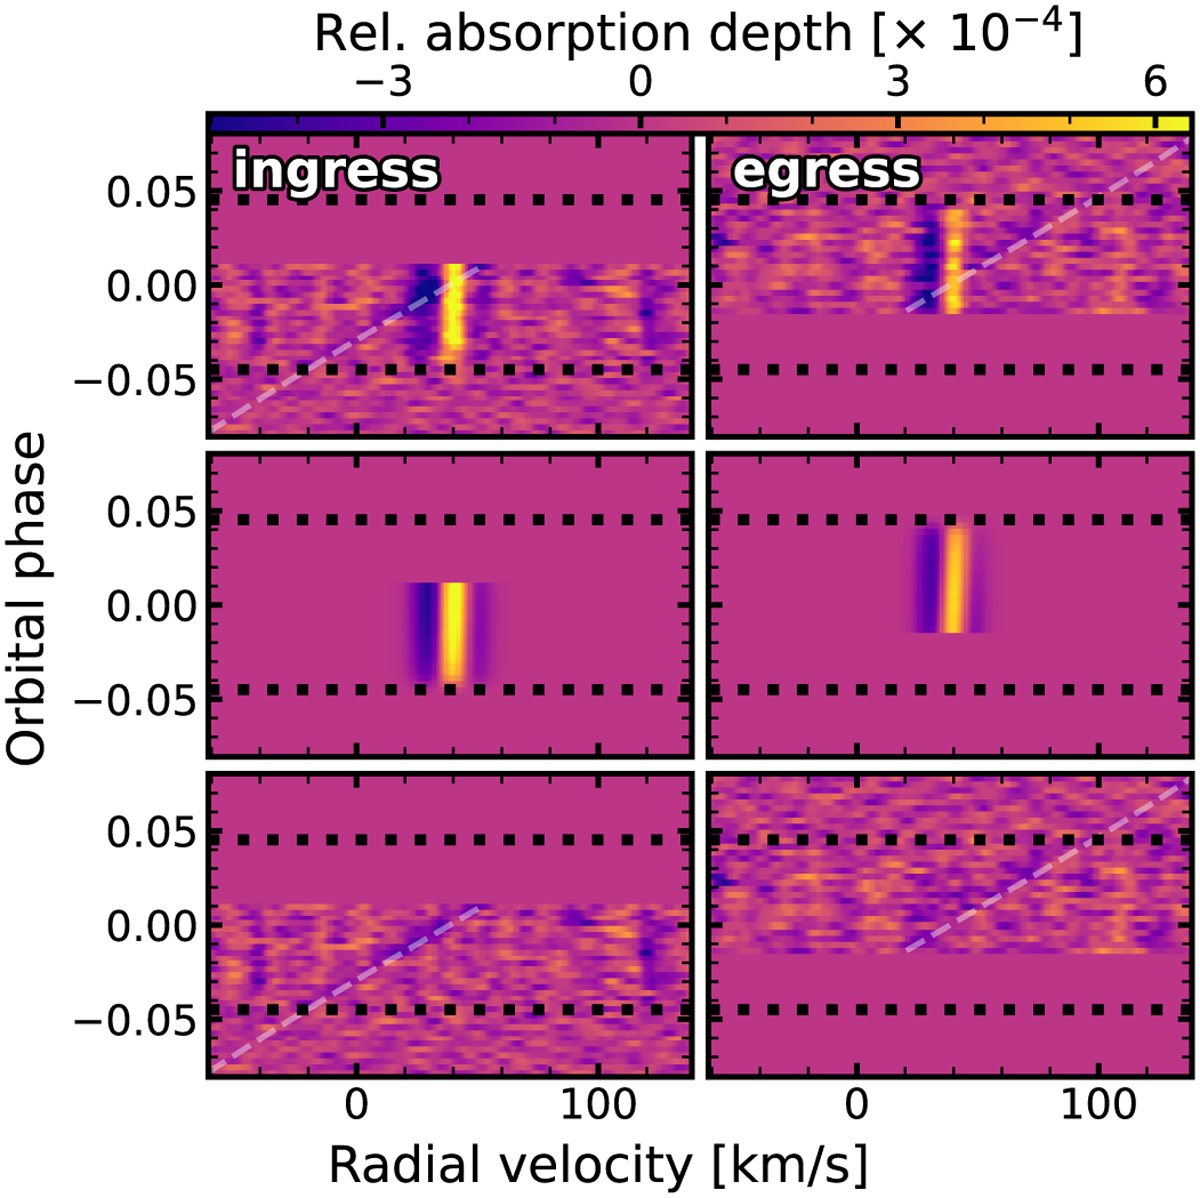
Best-fit Doppler shadow model for Ti I for the ingress (left) and egress (right) epochs. The dashed line indicates the expected location of the planetary trace to guide the eye. The black dotted lines indicate the transit contact times for clarity. We highlight that the colour maps have been inverted compared to Fig. 1 to reflect planetary absorption as a negative feature. Upper panels: Ti I cross-correlation maps prior to correction of the Doppler shadow. Middle panels: retrieved best-fit model for the Doppler shadow. Bottom panels: cross-correlation map after Doppler shadow correction.
Current usage metrics show cumulative count of Article Views (full-text article views including HTML views, PDF and ePub downloads, according to the available data) and Abstracts Views on Vision4Press platform.
Data correspond to usage on the plateform after 2015. The current usage metrics is available 48-96 hours after online publication and is updated daily on week days.
Initial download of the metrics may take a while.