Fig. 3
Download original image
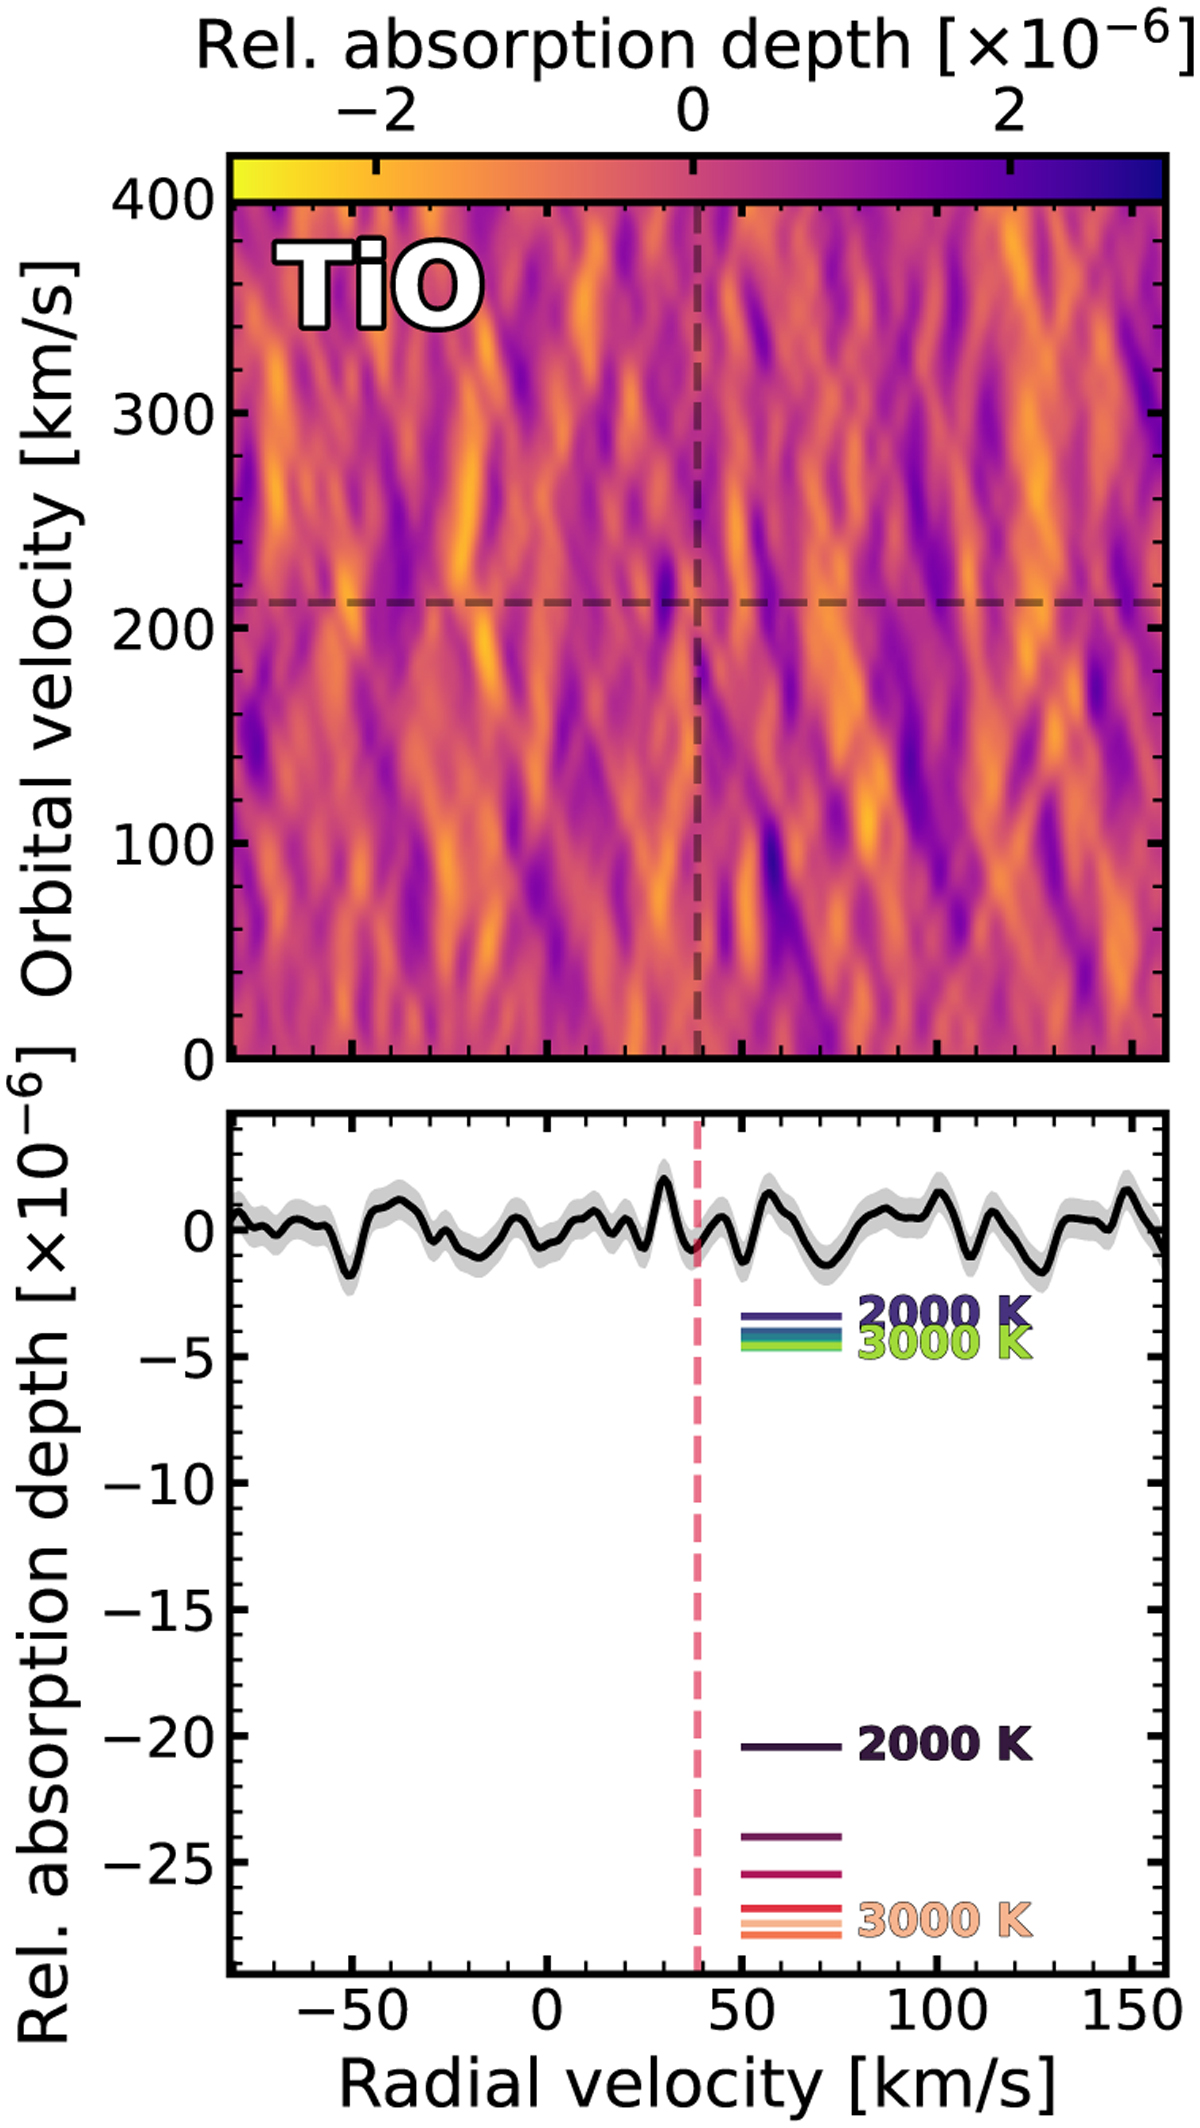
Cross-correlation map of TiO in Kp − Vsys space. Top panel: projected orbital velocity (horizontal dashed line) and systemic velocity (vertical dashed line) where the planetary signal is expected. Bottom panel: one-dimensional cross-correlation function at the expected orbital velocity. The noise-level is at 10−6. The horizontal thermometer lines at the bottom of the panel show the expected absorption depth is predicted by isothermal models for varying temperatures assuming a perfect line list. The temperature step is 200 K. The thermometer lines at the top of the panel are corrected by a factor of 6, empirically suggested by Prinoth et al. (2022) and Prinoth et al. (2023) to match the observed TiO absorption with the prediction.
Current usage metrics show cumulative count of Article Views (full-text article views including HTML views, PDF and ePub downloads, according to the available data) and Abstracts Views on Vision4Press platform.
Data correspond to usage on the plateform after 2015. The current usage metrics is available 48-96 hours after online publication and is updated daily on week days.
Initial download of the metrics may take a while.