Fig. 10
Download original image
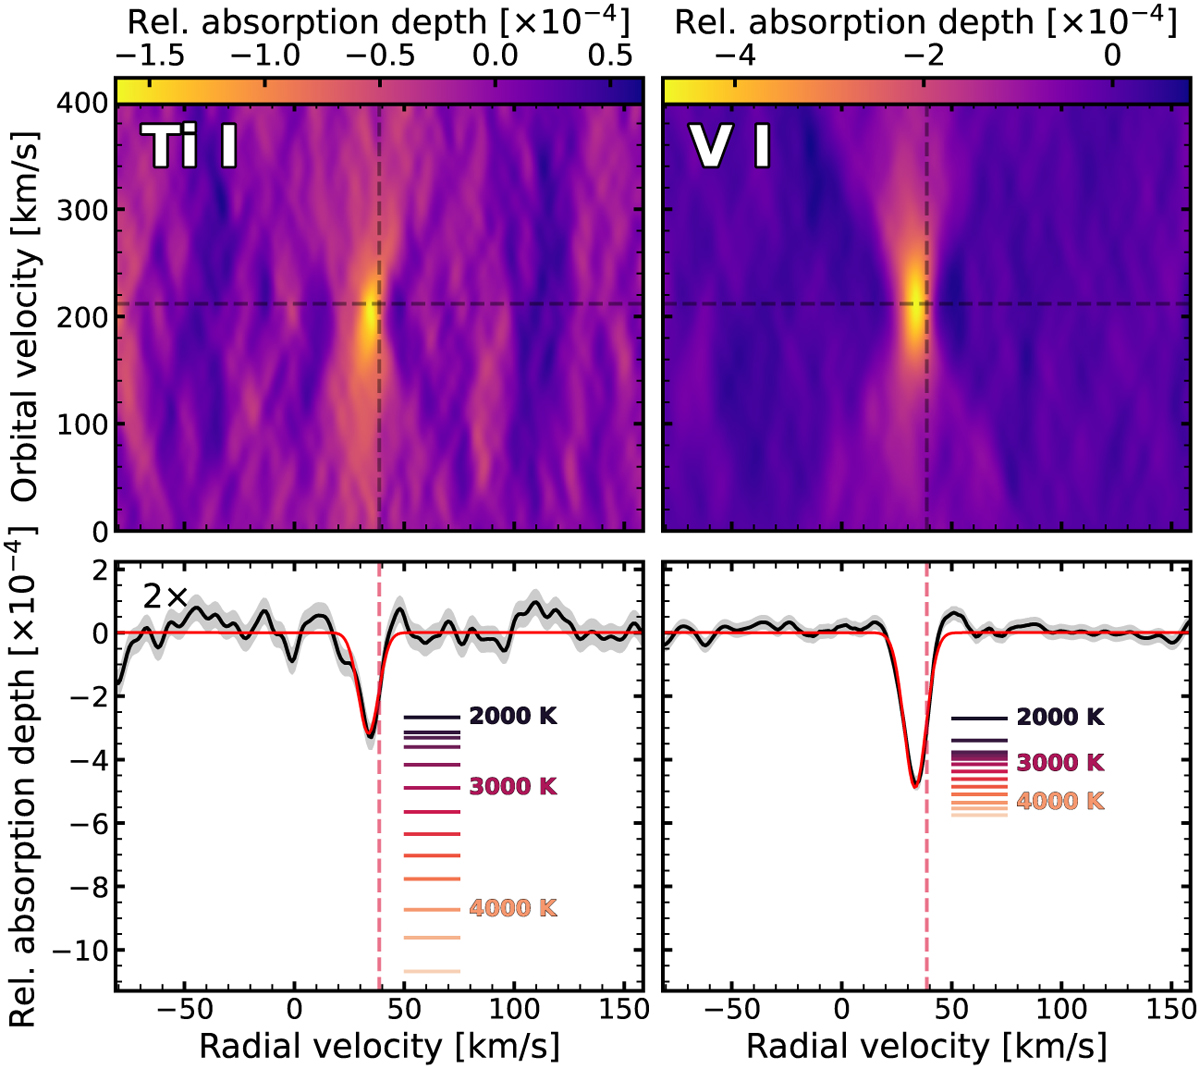
Cross-correlation results in Kp − Vsys space for Ti I (left) and V I (right). Top panels: two-dimensional cross-correlation map. The dashed lines indicate the expected location of the signal compared to a purely Keplerian orbit. Bottom panels: one-dimensional cross-correlation function at the orbital velocity of the strongest absorption from the upper panel. The Ti I panel is multiplied by two to ensure visibility. The horizontal lines indicate the expected absorption depth at the indicated model temperature. The increase between lines is 100 K. V I requires a temperature of ∼3900 K, while for Ti I, the thermometer suggests ∼2900 K. Together with Fig. 9, this suggests that Ti I is significantly depleted compared to V I.
Current usage metrics show cumulative count of Article Views (full-text article views including HTML views, PDF and ePub downloads, according to the available data) and Abstracts Views on Vision4Press platform.
Data correspond to usage on the plateform after 2015. The current usage metrics is available 48-96 hours after online publication and is updated daily on week days.
Initial download of the metrics may take a while.