Fig. 4
Download original image
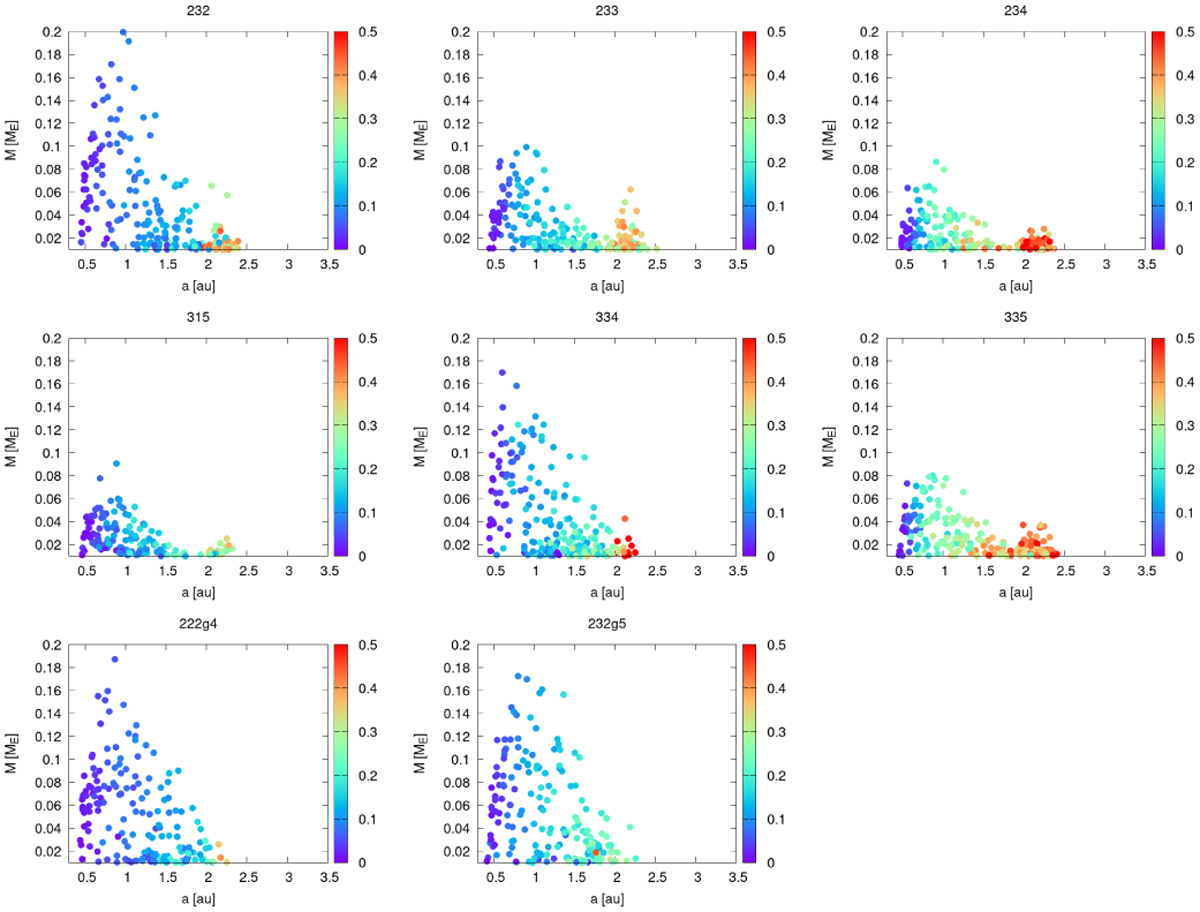
Embryo composition after 5 Myr. The panels show the final semi-major axis versus mass of the embryos for all seven sets of simulations. The colour-coding depicts the fraction of embryo mass that comes from the Jovian group. I note that there is a composition gradient, with the embryos close to 0.5 au having 5% of their mass from the Jovian region while this is closer to 20% for embryos at 1.5 au.
Current usage metrics show cumulative count of Article Views (full-text article views including HTML views, PDF and ePub downloads, according to the available data) and Abstracts Views on Vision4Press platform.
Data correspond to usage on the plateform after 2015. The current usage metrics is available 48-96 hours after online publication and is updated daily on week days.
Initial download of the metrics may take a while.