Fig. 9.
Download original image
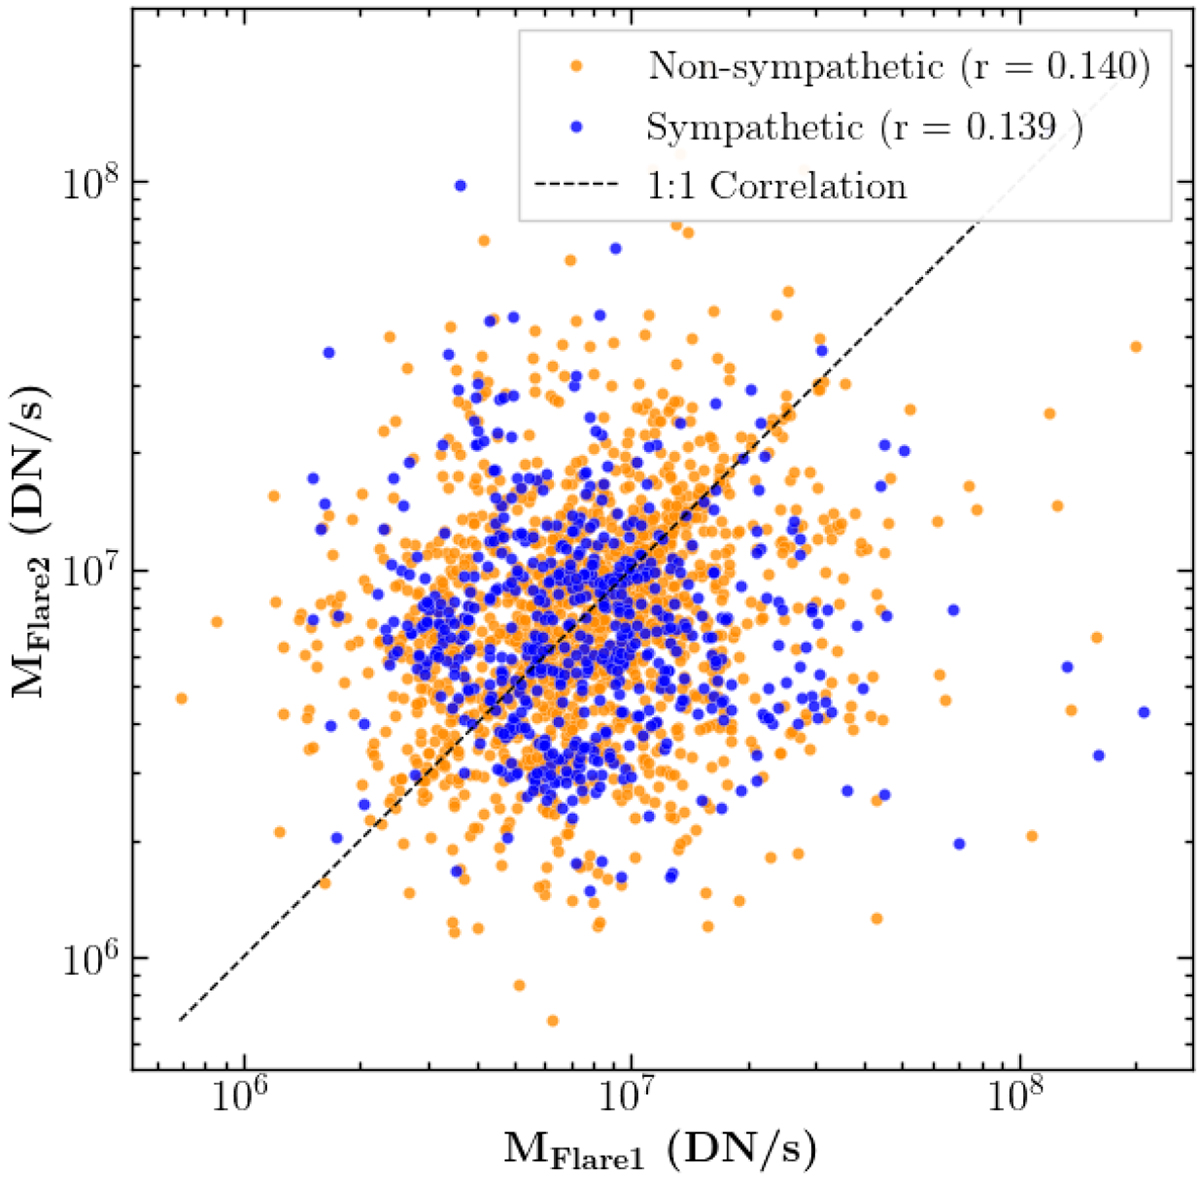
Peak magnitude of the second flare of 131 Å SDO/AIA against that of the first flare for each pair of consecutive non-sympathetic (orange) and sympathetic (blue) flares. The peak magnitude is expressed in Data Number per second, representing raw detector output not calibrated to irradiance units. The black dashed line corresponds to the 1:1 correlation line.
Current usage metrics show cumulative count of Article Views (full-text article views including HTML views, PDF and ePub downloads, according to the available data) and Abstracts Views on Vision4Press platform.
Data correspond to usage on the plateform after 2015. The current usage metrics is available 48-96 hours after online publication and is updated daily on week days.
Initial download of the metrics may take a while.