Fig. 7.
Download original image
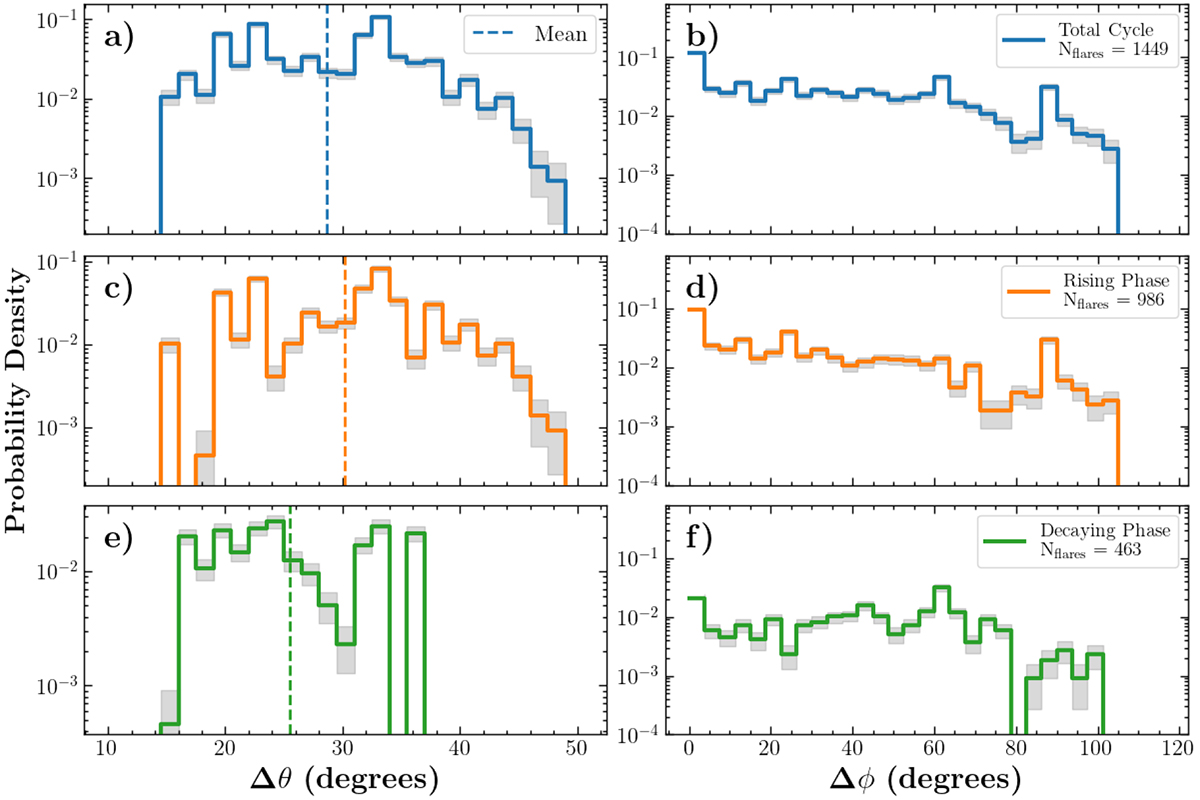
Angular separation in latitude (left) and longitude (right) between consecutive transequatorial flares observed by SDO/AIA with w ≤ 1.5 hour. Panels a and b cover the full solar cycle 24, c, d the rising phase, and e, f the decaying phase. Phases match those in Figure 6, with vertical black dashed lines in Figure 2. Histograms are normalized so the total cycle (blue curve) integrates to unity. The gray area shows the ![]() counting error, and dashed lines in (a) mark distribution means.
counting error, and dashed lines in (a) mark distribution means.
Current usage metrics show cumulative count of Article Views (full-text article views including HTML views, PDF and ePub downloads, according to the available data) and Abstracts Views on Vision4Press platform.
Data correspond to usage on the plateform after 2015. The current usage metrics is available 48-96 hours after online publication and is updated daily on week days.
Initial download of the metrics may take a while.