Fig. 6.
Download original image
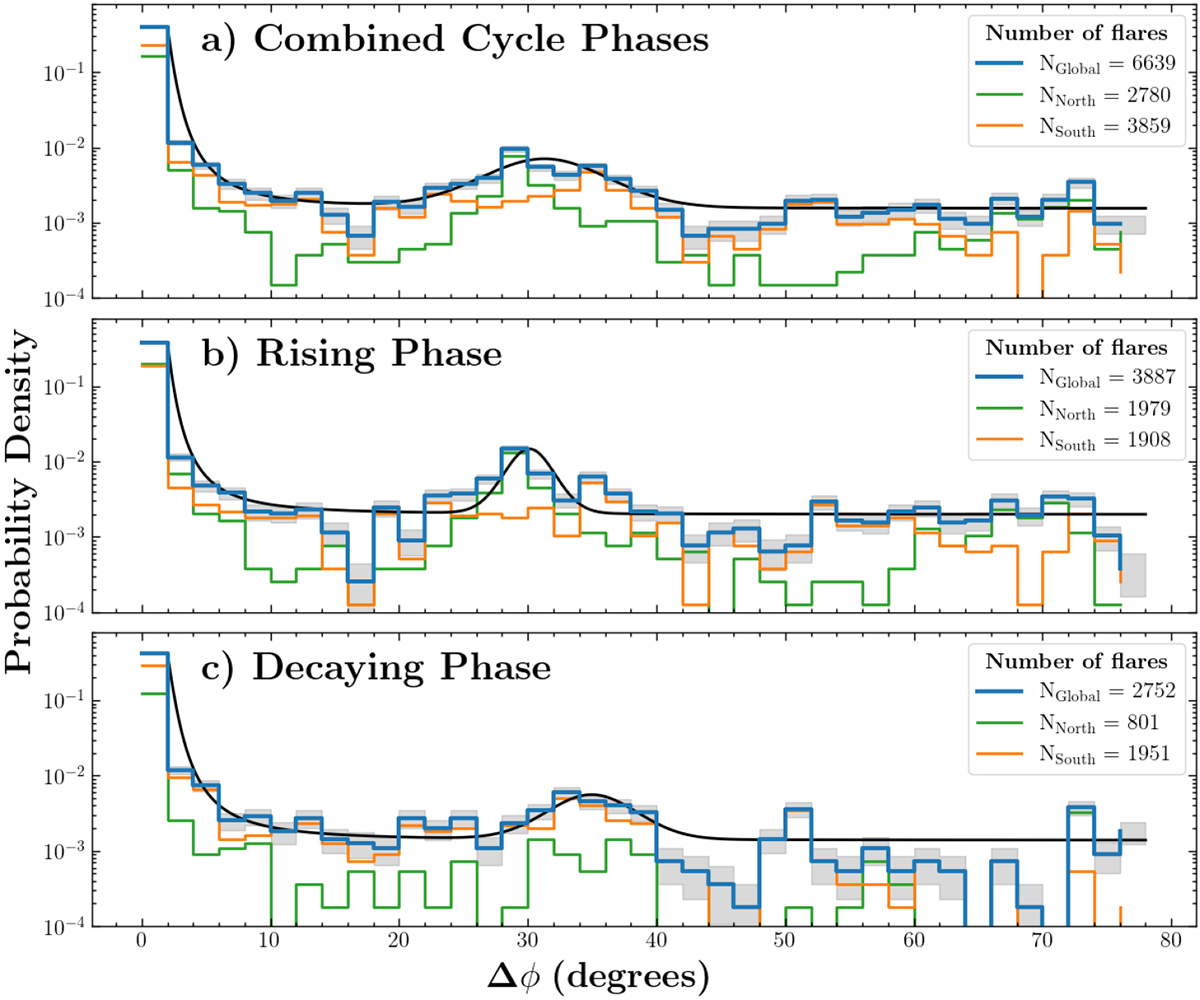
Distribution of Δϕ separation of all hemispheric (blue), northern hemisphere (green), and southern hemisphere (orange) flare pairs with w ≤ 1.5 hour. Panels a–c consider the whole cycle 24, the rising phase and the decaying phase, respectively. The time intervals are shown as vertical black dashed lines in Figure 2. The histograms are normalized so that the combined global distribution of both hemispheres integrates to unity. The black solid lines indicate fits of Equation (3) and the gray area indicates the ![]() counting error.
counting error.
Current usage metrics show cumulative count of Article Views (full-text article views including HTML views, PDF and ePub downloads, according to the available data) and Abstracts Views on Vision4Press platform.
Data correspond to usage on the plateform after 2015. The current usage metrics is available 48-96 hours after online publication and is updated daily on week days.
Initial download of the metrics may take a while.