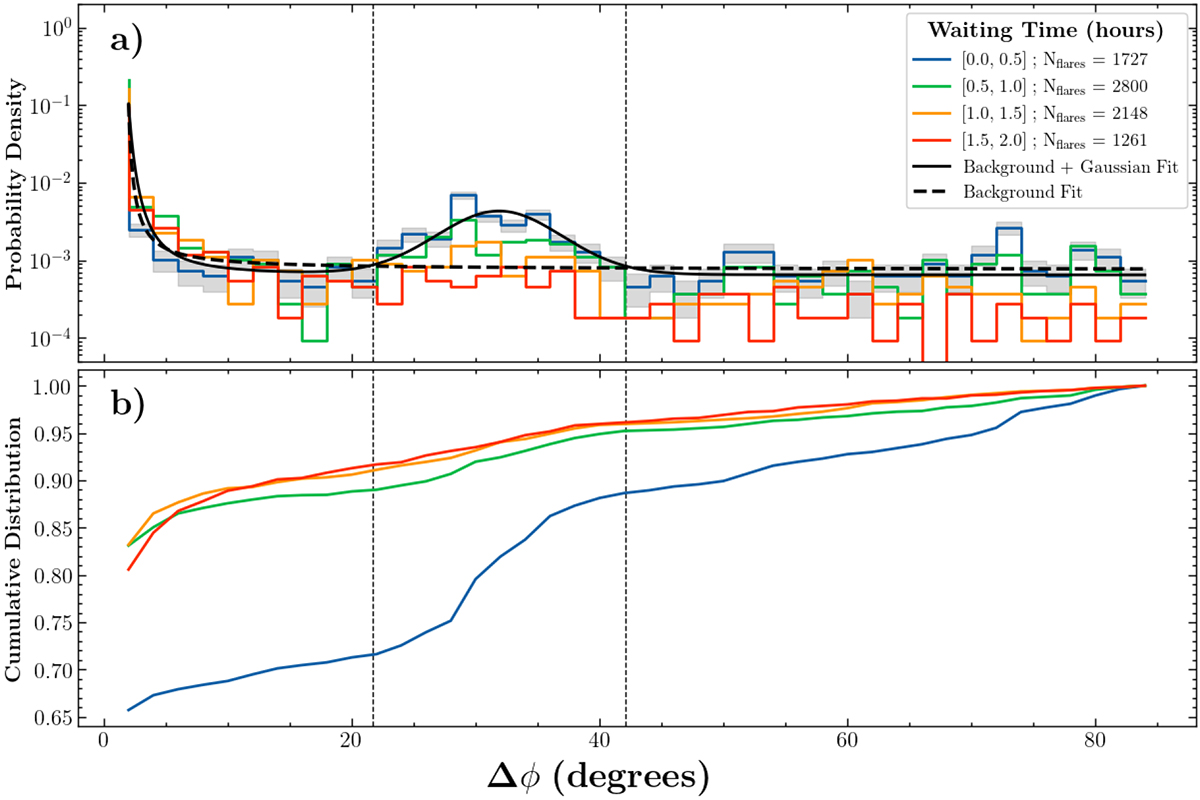
Fig. 5.
Download original image
Longitudinal separation distribution between hemispheric flares from Figure 4e for different waiting time intervals (panel a). The solid and dashed black lines are fits of Equation (3), with and without the Gaussian component respectively. The vertical dashed lines delimit the interval Δϕ ∈ [Δϕ0 ± 2σ] from the Gaussian fit. We note the vertical logarithmic scale. Panel b shows the corresponding cumulative distribution function.
Current usage metrics show cumulative count of Article Views (full-text article views including HTML views, PDF and ePub downloads, according to the available data) and Abstracts Views on Vision4Press platform.
Data correspond to usage on the plateform after 2015. The current usage metrics is available 48-96 hours after online publication and is updated daily on week days.
Initial download of the metrics may take a while.