Fig. 4.
Download original image
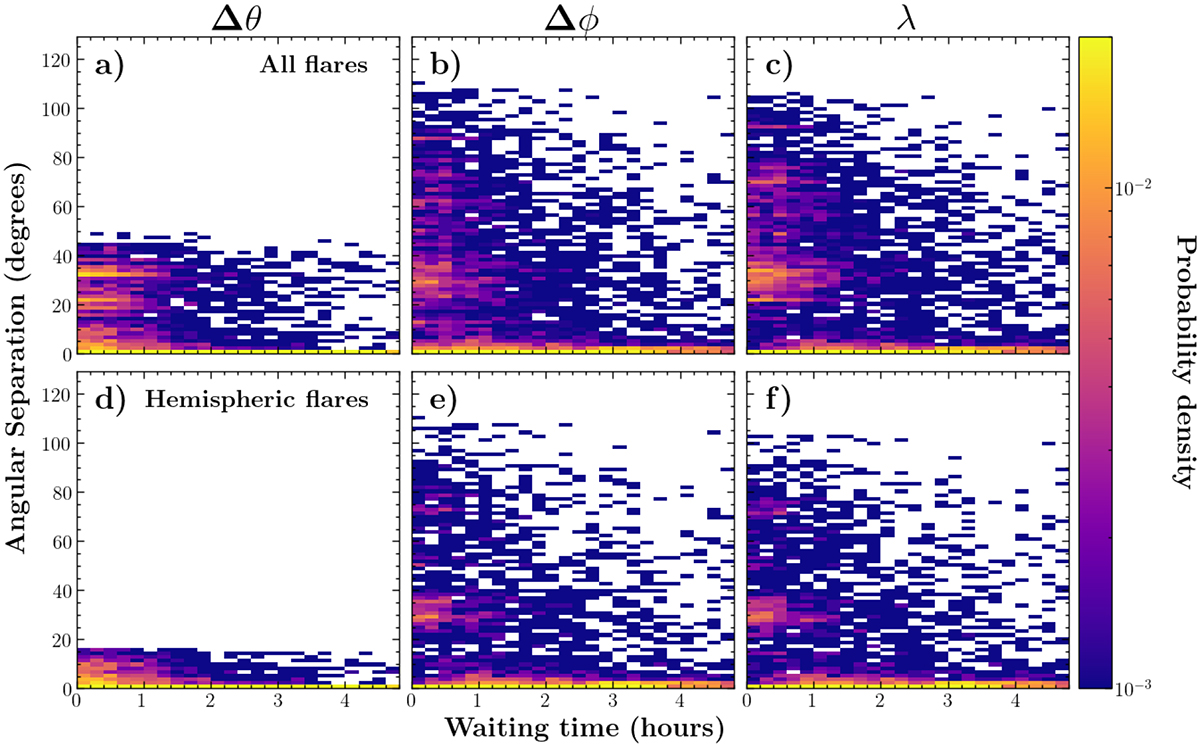
Distributions of angular separation in latitude (left), longitude (middle), and total angle (right) in degrees against waiting time in hours for flares observed by SDO/AIA between June 11, 2010, and January 26, 2019. In panels a–c, all flares from both hemispheres are used while in panels d–f, we first separated the flares from the northern and southern hemispheres and combine the distributions. The histograms have been normalized to show the probability densities.
Current usage metrics show cumulative count of Article Views (full-text article views including HTML views, PDF and ePub downloads, according to the available data) and Abstracts Views on Vision4Press platform.
Data correspond to usage on the plateform after 2015. The current usage metrics is available 48-96 hours after online publication and is updated daily on week days.
Initial download of the metrics may take a while.