Fig. 2.
Download original image
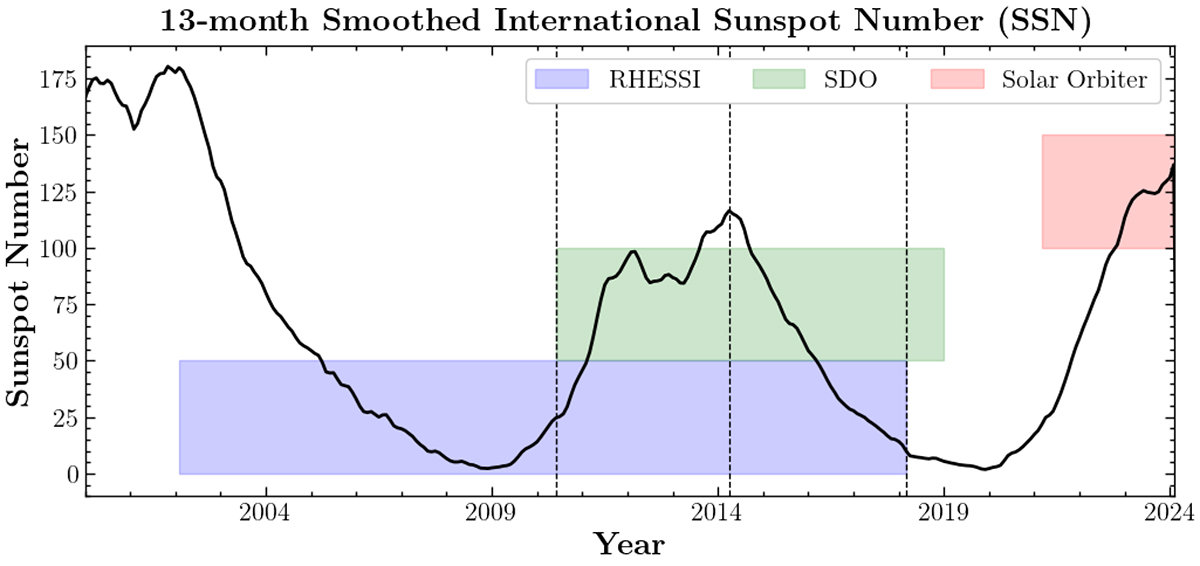
Temporal coverage of each flare list considered in this study, namely RHESSI (blue), SDO/AIA (green), and Solar Orbiter/STIX (red). Plotted on top is the 13-month smoothed sunspot number showing the activity cycle of the Sun, downloaded from SILSO World Data Center (2000–2024), Royal Observatory of Belgium. The vertical black dashed lines mark the time intervals referenced in Sections 3.1, 3.2, 4.1 and 4.2 used to divide the solar cycle into its rising and decaying phases, specifically on June 1, 2010; on April 1, 2014; and on March 1, 2018.
Current usage metrics show cumulative count of Article Views (full-text article views including HTML views, PDF and ePub downloads, according to the available data) and Abstracts Views on Vision4Press platform.
Data correspond to usage on the plateform after 2015. The current usage metrics is available 48-96 hours after online publication and is updated daily on week days.
Initial download of the metrics may take a while.