Fig. B.3.
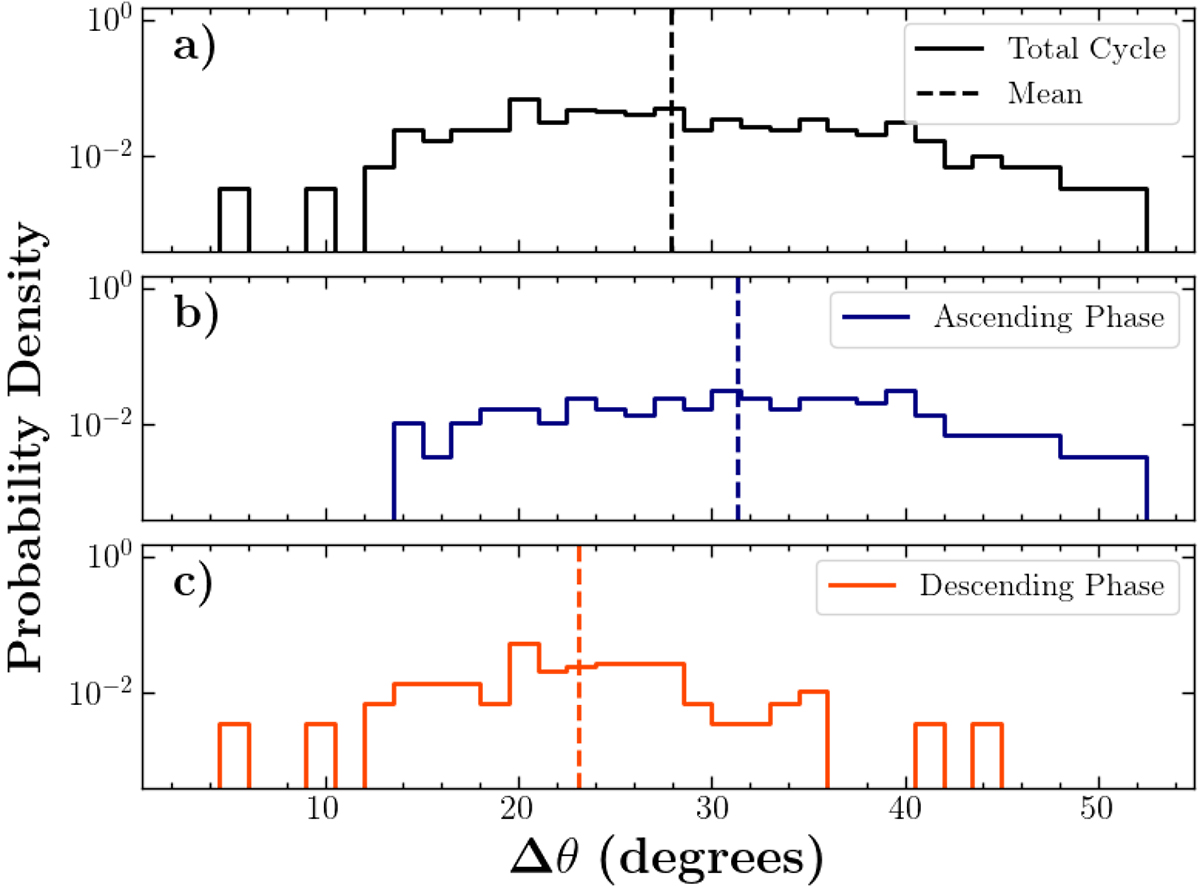
Download original image
Distribution of angular separation in latitude between pairs of closest transequatorial active regions with Δϕ ≲ 5°. Panel (a) to (c) consider active regions present during nearly the entire solar cycle 24 (Carrington rotations 2098-2201), the rising phase (Carrington rotations 2098-2149) and the decaying phase (Carrington rotations 2150-2201), respectively. The time intervals approximately correspond to those indicated by the vertical black dashed lines in Figure 2. The vertical dashed lines indicate the distribution means.
Current usage metrics show cumulative count of Article Views (full-text article views including HTML views, PDF and ePub downloads, according to the available data) and Abstracts Views on Vision4Press platform.
Data correspond to usage on the plateform after 2015. The current usage metrics is available 48-96 hours after online publication and is updated daily on week days.
Initial download of the metrics may take a while.