Fig. B.2.
Download original image
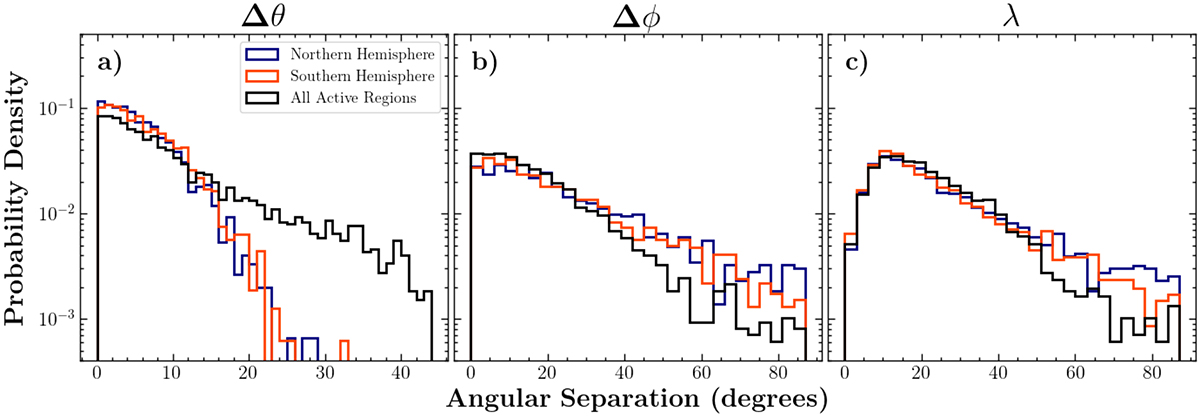
Distribution of the angular separation in latitude (a), longitude (b) and total angle (c) between pairs of closest active regions overlapping in time on the solar disk. In each panel, we plot the distribution by considering active regions in the northern hemisphere only (blue), the southern hemisphere only (red) and all active regions from both hemispheres (black). The distributions are constructed using active regions listed in the Heliophysics Events Knowledgebase that have an associated NOAA number for the period from January 7, 2002, to February 14, 2024, which covers the time frames of the various flare lists used in this study (see Figure 2).
Current usage metrics show cumulative count of Article Views (full-text article views including HTML views, PDF and ePub downloads, according to the available data) and Abstracts Views on Vision4Press platform.
Data correspond to usage on the plateform after 2015. The current usage metrics is available 48-96 hours after online publication and is updated daily on week days.
Initial download of the metrics may take a while.