Open Access
Fig. B.1.
Download original image
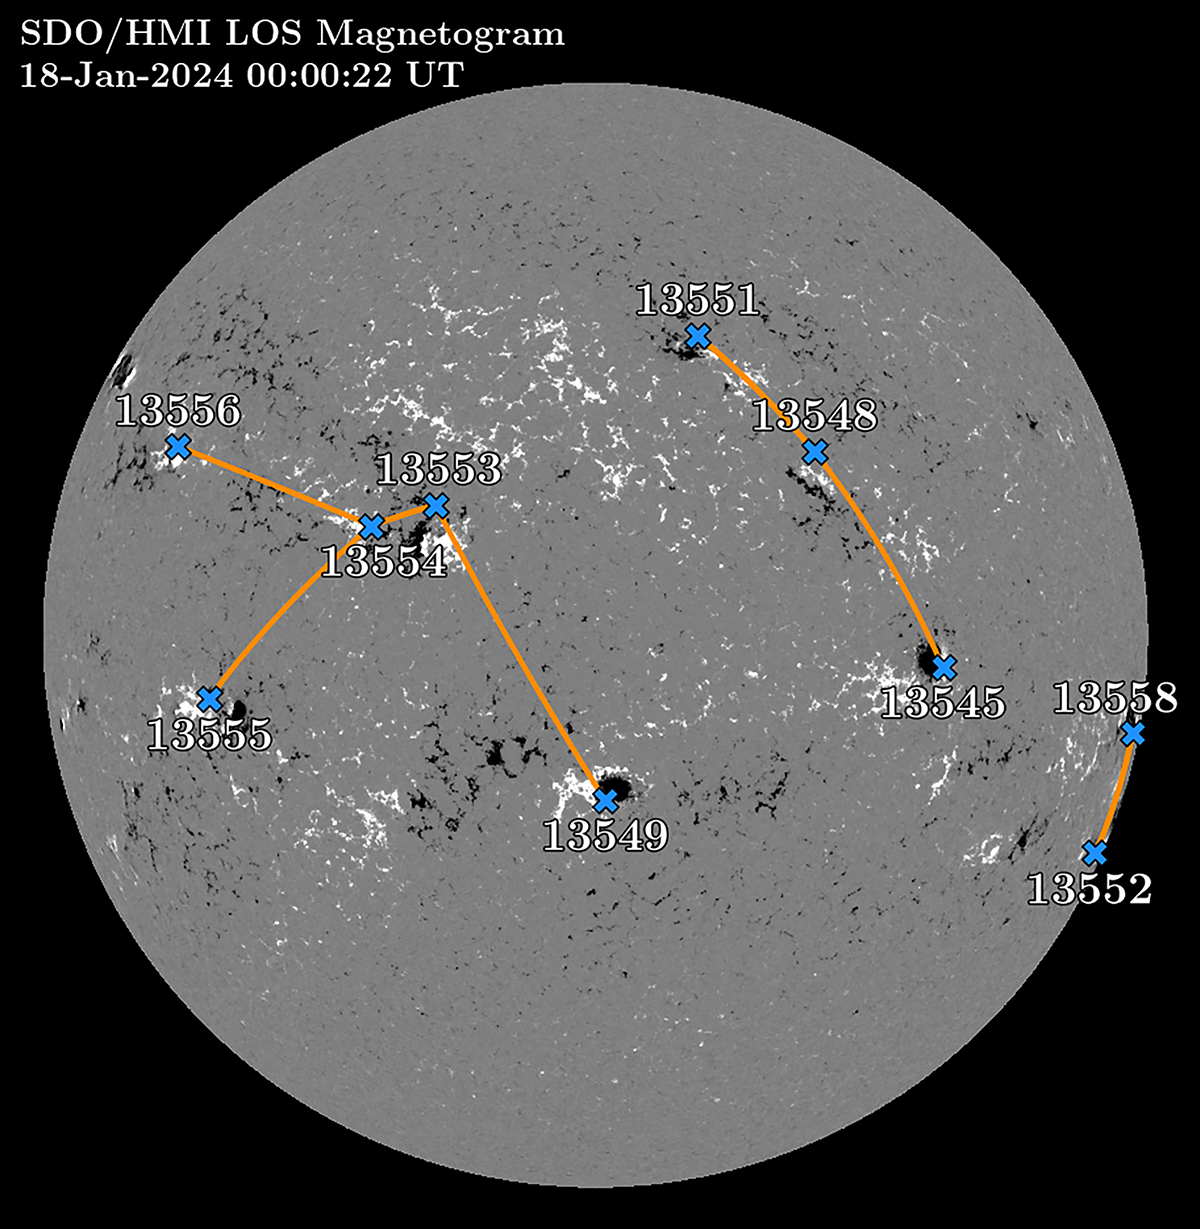
Identification of NOAA active regions on January 18, 2024, 00:00:22 UT marked by blue crosses on an SDO/HMI magnetogram. The orange lines represent the pairing of the closest active regions across both hemispheres, which is used to construct the distribution of their angular separation.
Current usage metrics show cumulative count of Article Views (full-text article views including HTML views, PDF and ePub downloads, according to the available data) and Abstracts Views on Vision4Press platform.
Data correspond to usage on the plateform after 2015. The current usage metrics is available 48-96 hours after online publication and is updated daily on week days.
Initial download of the metrics may take a while.