Fig. 13.
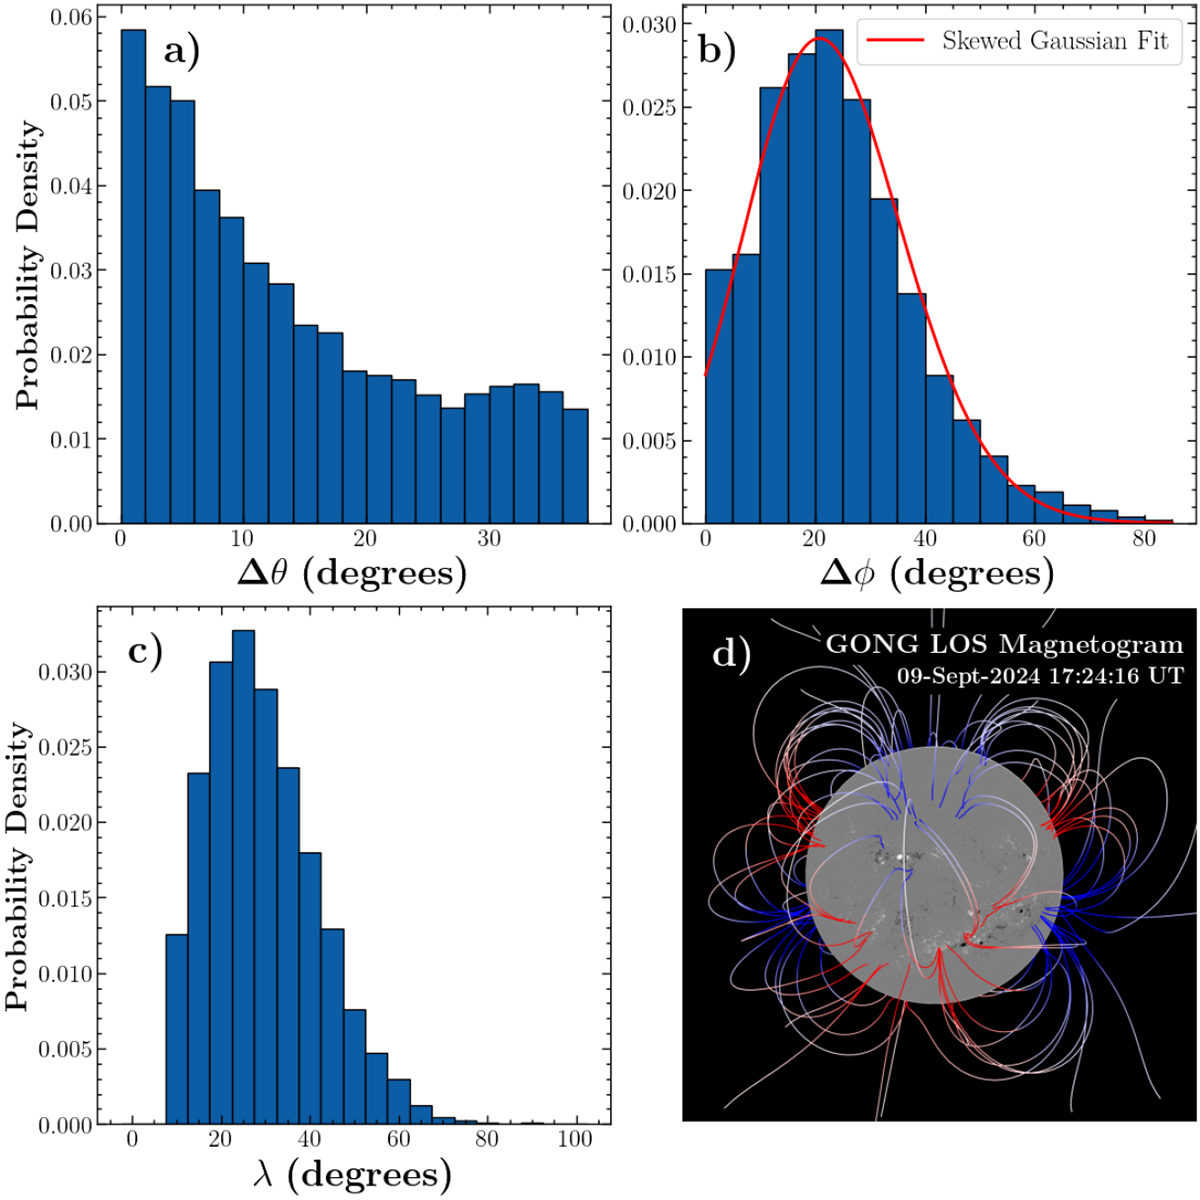
Download original image
Distribution of the angular separation in latitude (a), longitude (b), and total angle (c) between the footpoints of closed magnetic field lines. We considered field lines whose footpoints are on the same hemisphere and separated by λ ≥ 10° to exclude field lines closing in a single active region. The field lines were generated by PFSS extrapolations made using the pfsspy code from Stansby et al. (2020), with the source surface radius at rSS = 2.5 R⊙ and using GONG magnetograms between June 16, 2010, and February 23, 2018, as photospheric boundary conditions. The time intervals approximately correspond to those indicated by the vertical black dashed lines in Figure 2. In panel d, we show an example of a PFSS extrapolation using a GONG magnetogram on September 9, 2024, in JHelioviewer (Müller et al. 2017). In panel c, the red line is a fit of a skewed Gaussian function: ![]() .
.
Current usage metrics show cumulative count of Article Views (full-text article views including HTML views, PDF and ePub downloads, according to the available data) and Abstracts Views on Vision4Press platform.
Data correspond to usage on the plateform after 2015. The current usage metrics is available 48-96 hours after online publication and is updated daily on week days.
Initial download of the metrics may take a while.