Fig. 11.
Download original image
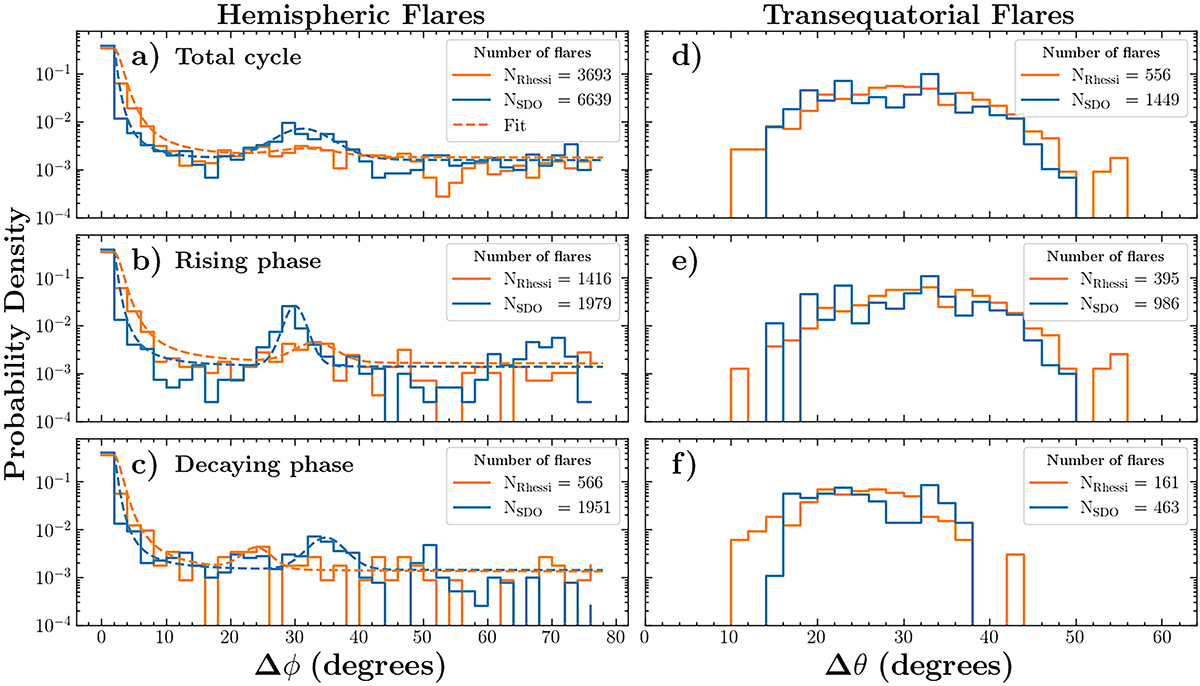
Distribution of Δϕ for hemispheric flares (panels a–c) and Δθ for transequatorial flares (panels d–f) with w ≤ 1.5 hours comparing RHESSI (orange) and SDO/AIA (blue). The first, second and third row correspond to the total cycle, the rising phase and the decaying phase, respectively. The fits of Equation (3) are shown as dashed lines. Northern hemisphere and southern hemisphere flares are used in panel b and c respectively to maximize the signal (see Figure 6 for hemispheric asymmetry).
Current usage metrics show cumulative count of Article Views (full-text article views including HTML views, PDF and ePub downloads, according to the available data) and Abstracts Views on Vision4Press platform.
Data correspond to usage on the plateform after 2015. The current usage metrics is available 48-96 hours after online publication and is updated daily on week days.
Initial download of the metrics may take a while.