Fig. 10.
Download original image
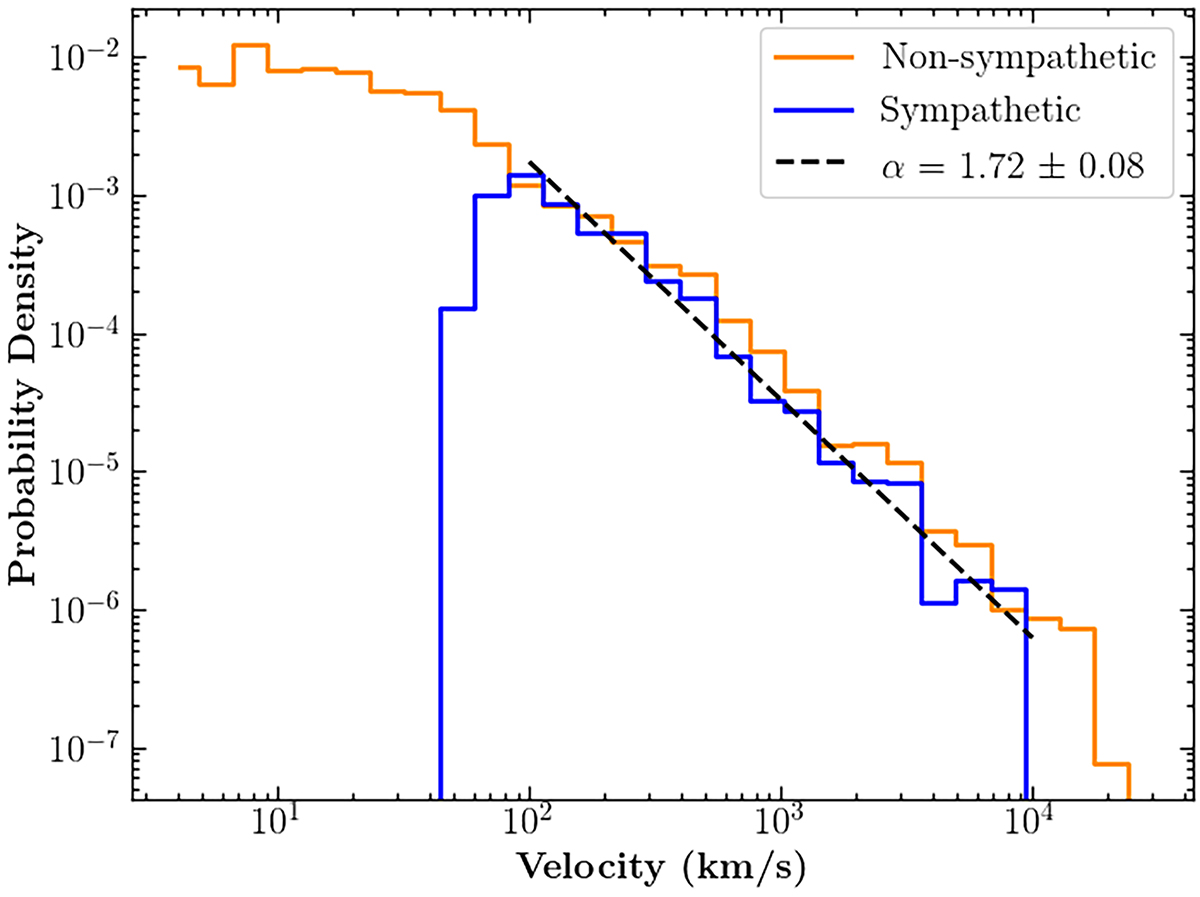
Distribution of propagation velocities for a signal traveling the angular distance λ over the waiting time w between consecutive non-sympathetic (orange) and sympathetic (blue) flares. The black dashed line indicates a power-law fit. We only included non-sympathetic flares with w < 6 hours and separated by λ > 5° to exclude flares triggered by the same active region.
Current usage metrics show cumulative count of Article Views (full-text article views including HTML views, PDF and ePub downloads, according to the available data) and Abstracts Views on Vision4Press platform.
Data correspond to usage on the plateform after 2015. The current usage metrics is available 48-96 hours after online publication and is updated daily on week days.
Initial download of the metrics may take a while.