Fig. 1.
Download original image
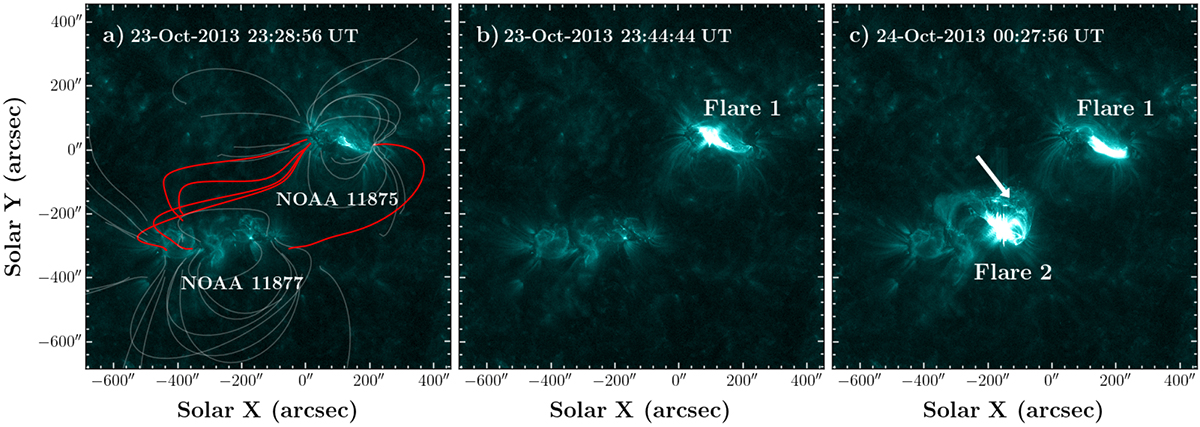
Example of a candidate sympathetic event observed by SDO/AIA at 131 Å on October 23–24, 2013, with panels a to c showing the chronological evolution of the flaring regions. In panel a, the white and red lines represent a PFSS extrapolation made using the pfsspy code from Stansby et al. (2020), with the source surface radius at rSS = 2.5 R⊙. In panel c, the white arrow indicates the location of a loop brightening connecting the two active regions (NOAA 11875 and NOAA 11877). An animated version of this figure is available online.
Current usage metrics show cumulative count of Article Views (full-text article views including HTML views, PDF and ePub downloads, according to the available data) and Abstracts Views on Vision4Press platform.
Data correspond to usage on the plateform after 2015. The current usage metrics is available 48-96 hours after online publication and is updated daily on week days.
Initial download of the metrics may take a while.