Fig. 8.
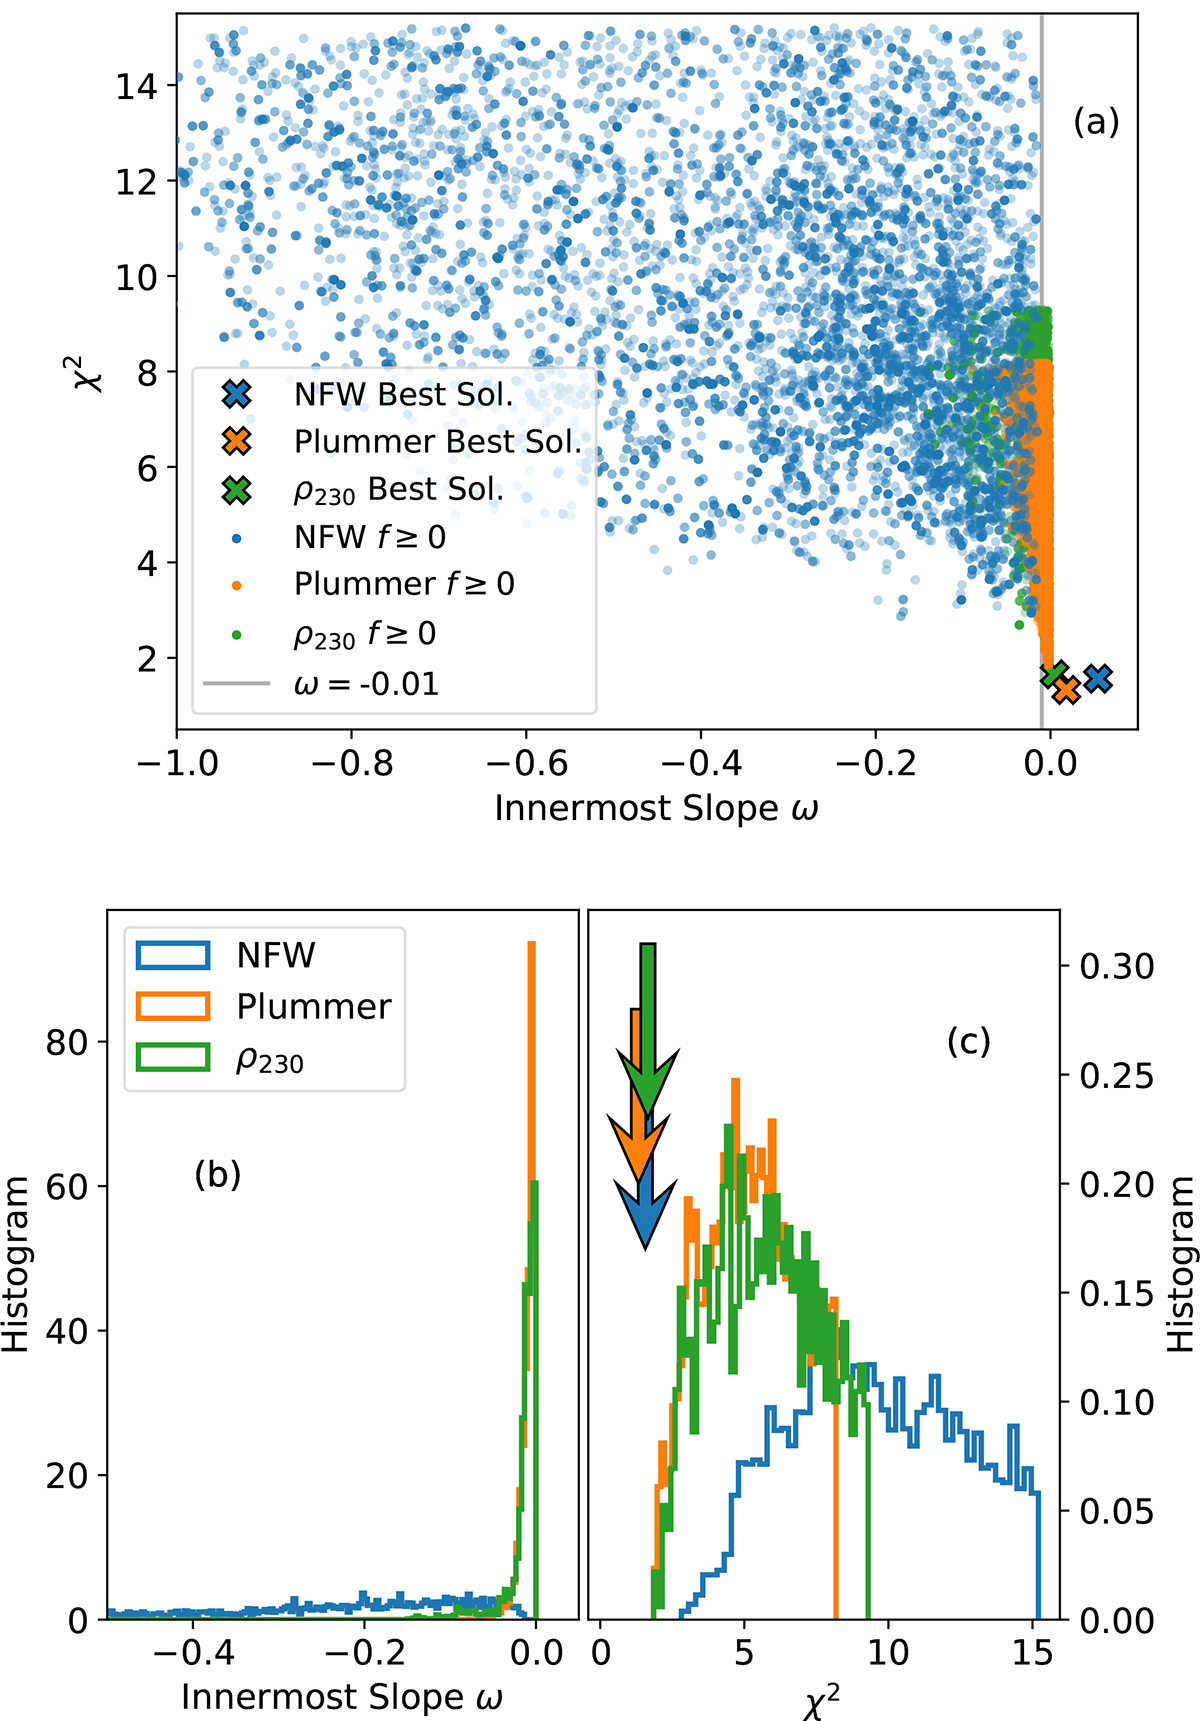
Download original image
(a) Scatter plot χ2 versus innermost slope ω of the fits for the three potentials resulting from the MCMC navigation of the posterior. The large times symbols represent the best fit obtained with unconstrained f(ϵ), which yield unphysical f(ϵ) < 0. The vertical gray line marks ω = −0.01. (b) Histograms of the distribution of innermost slopes for the points in (a). (c) Histograms of χ2 for the points in (a). The arrows represent the χ2 of the best fit obtained with unconstrained f(ϵ). Panels a, b, and c share the same color code as indicated in the insets.
Current usage metrics show cumulative count of Article Views (full-text article views including HTML views, PDF and ePub downloads, according to the available data) and Abstracts Views on Vision4Press platform.
Data correspond to usage on the plateform after 2015. The current usage metrics is available 48-96 hours after online publication and is updated daily on week days.
Initial download of the metrics may take a while.