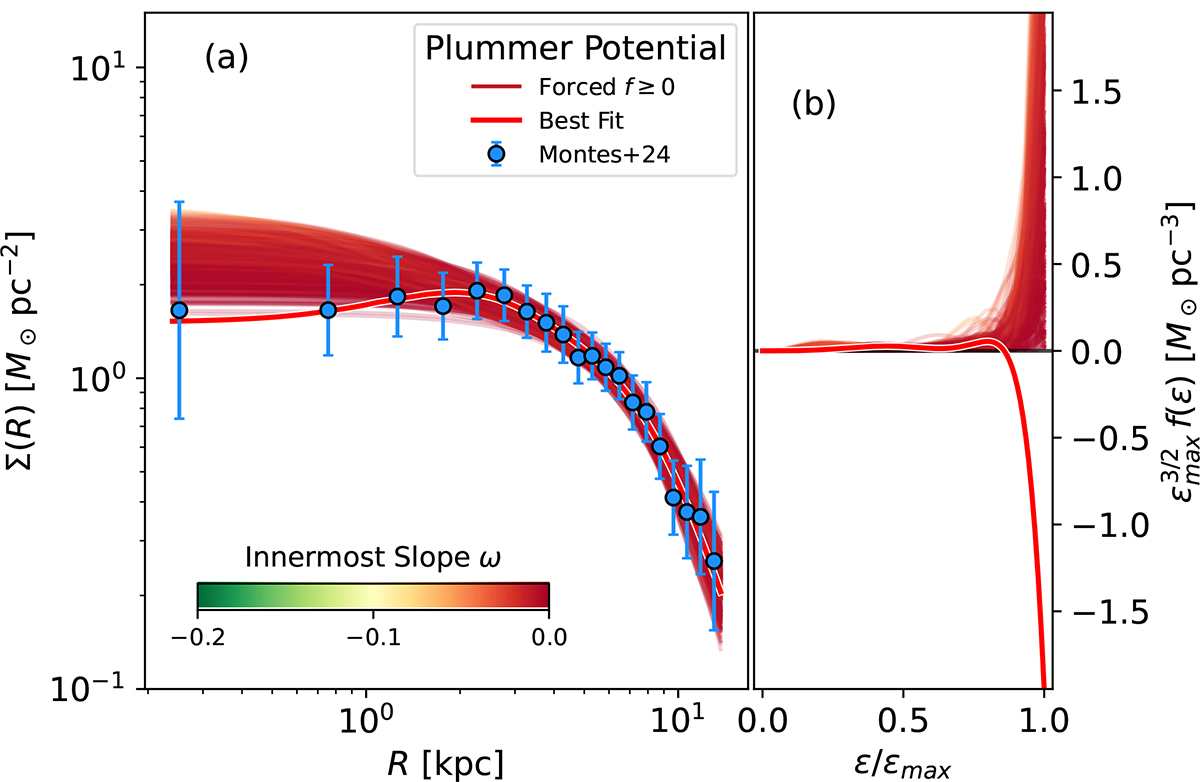
Fig. 6.
Download original image
Diagnostic plot for the technique. (a) Fit to the stellar mass surface density observed in Nube (the blue symbols) assumed to reside in a Schuster-Plummer potential. The red thick solid line represents the least-squares best fit with an unconstrained DF f(ϵ), whereas the other thin lines are the fits derived from the MCMC exploration of the posterior forcing f(ϵ) to be ≥0∀ϵ and beginning the exploration from the f(ϵ)≥0 least squares solution. These other fits are color coded according to the innermost slope of the surface density profile (ω in Eq. (27)), which always happens to be negative but close to zero. (b) DFs required by the best fit and by the fits forced to have f(ϵ)≥0. Note how the best fit requires f(ϵ) < 0 and so is unphysical. The color code is the same as in (a).
Current usage metrics show cumulative count of Article Views (full-text article views including HTML views, PDF and ePub downloads, according to the available data) and Abstracts Views on Vision4Press platform.
Data correspond to usage on the plateform after 2015. The current usage metrics is available 48-96 hours after online publication and is updated daily on week days.
Initial download of the metrics may take a while.