Fig. E.5.
Download original image
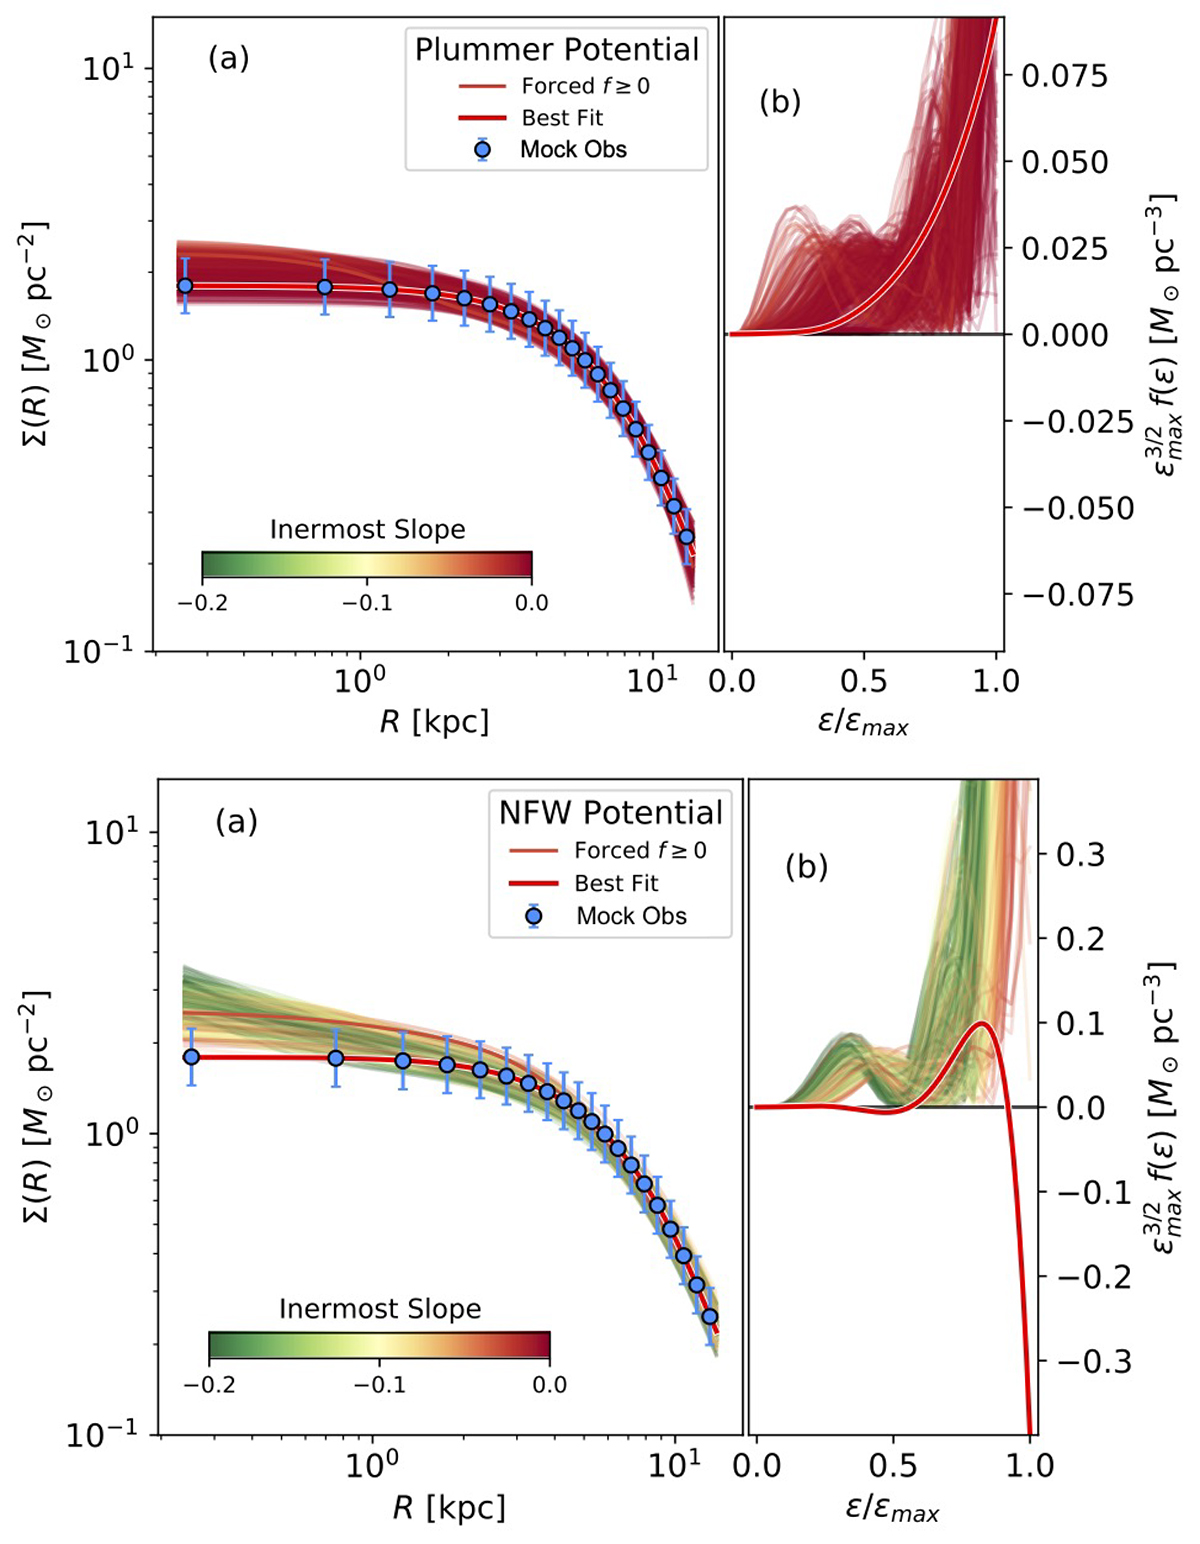
Summary of the analysis carried out with a mock mass surface density profile corresponding to a Schuster-Plummer profile (the symbols labeled as Mock Obs). The figures are similar to Figs. 6, 7, and 9 in the main text. The result assuming a Schuster-Plummer potential is shown in the top panels whereas the result assuming a NFW potential is in the bottom panels. Note how the free-f(ϵ) fits (the thick red lines) yield f(ϵ) > 0 for the Schuster-Plummer potential whereas it requires f(ϵ) < 0 for the NFW potential. The fits forced to have f(ϵ) > 0 (color thin lines) are much worst in the case of the NFW profile. The color code is the same in the two panels and also the same of the code used in the figures of the main text.
Current usage metrics show cumulative count of Article Views (full-text article views including HTML views, PDF and ePub downloads, according to the available data) and Abstracts Views on Vision4Press platform.
Data correspond to usage on the plateform after 2015. The current usage metrics is available 48-96 hours after online publication and is updated daily on week days.
Initial download of the metrics may take a while.